Values Series Miami-Dade County
Values
A Data-Driven Insights Series for Luxury Real Estate
Miami-Dade County
Coral Gables | Coconut Grove | Key Biscayne | Miami Beach | All Miami-Dade

Welcome to the Values content series by Jennie Frank Kapoor of Tropical Phoenix Homes. In this series, we take a look at broader market-level insights and trends with a focus on the numbers in an executive summary format. This series will focus on monthly and quarterly updates with a bigger picture in mind. Coupled with our neighborhood and building deep dives, this will give my clients, prospective clients, and collaborators both the macro and micro views of the tropical markets we work within.
A Few General Notes About This Post:
- All data reflects criteria focused on $1M+ properties, where I specialize in for my sales and REIMAGINE businesses.
- All the data, charts, and analysis presented in this report are broken down between i) Single-Family Homes (SFHs) and ii) Townhouses / Condos to give a more accurate view to our audience of property types and their performance in the market.
- This report has a date range focused on June 2023 through June 2024 / Q2. July will be a part of my next report once source data is verified and closed for the month through Florida Realtors.
- Information is segmented by the local markets I specifically cover for sales and REIMAGINE projects. We also zoom out to the broader South Florida counties for context.
Counties and Cities:
- Miami-Dade (this post)
- Broward (click here to read)
- Fort Lauderdale
- Sea Ranch Lakes
- Lauderdale-by-the-Sea
- Pompano Beach
- Palm Beach (click here to read)
- West Palm Beach
- Palm Beach
- Delray Beach
- Boca Raton
- For an insightful micro-level understanding of the market, please dig into my neighborhood deep dives and community pages. It's also my pleasure to prepare a complimentary market analysis and broker opinion of value for anyone looking to buy or sell a primary residence, secondary home, or investment property.
CORAL GABLES
I. Single Family Homes (SFHs)
View Available ListingsSnapshot

Closed Sales


Observations:
- While closed sales of luxury SFHs in Coral Gables are trending up in volume this year, the year-over-year (YoY) change in decline is noticeable (with 8 of the last 12 months down compared to last year). This likely reflects that it’s a little “harder” to get deals done, especially with sellers that are dug-in, but it’s also relative, contextually, to some of the highest pricing appreciation anywhere in the country over the last few years. Finding some equilibrium is healthy for the market. You can feel (and see) the market picking up as of a few months ago.
Total Dollars Closed
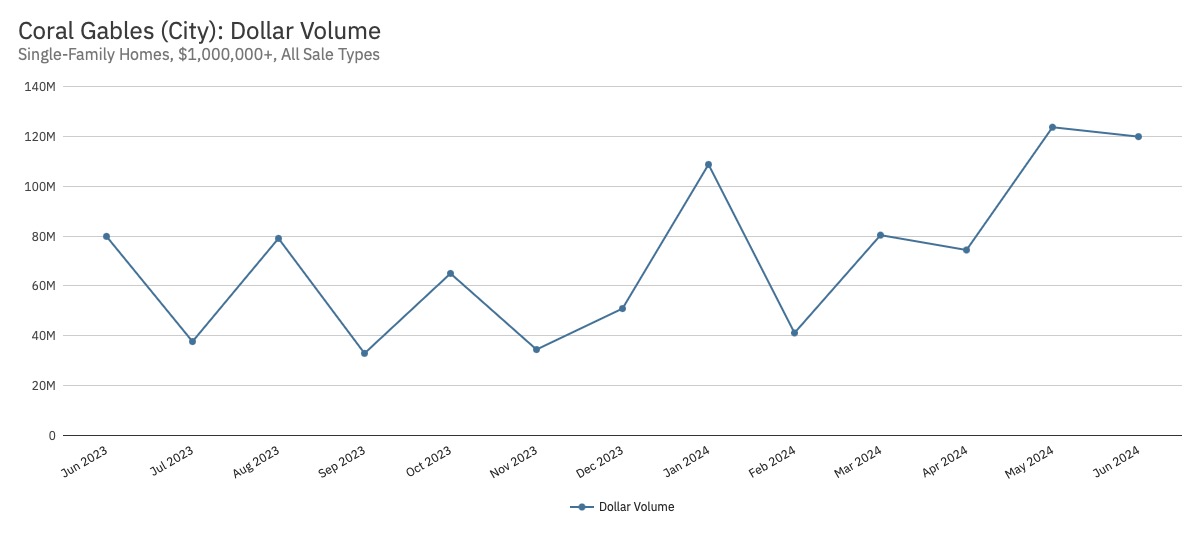

Observations:
- While closed sales dollars are trending up in volume this year, with some notably high months (three over $100M!), the YoY change has evenly seen both positive and negative fluctuations. Given that the number of sales transactions is recently down YoY, but dollar volume is up, this likely reflects some larger individual transactions (which aligns with the market narrative in the Gables).
Median Sales Price


Observations:
- After a slow start to the year with a dip in pricing, the median sales price has notably increased both in terms of gross dollars and YoY change. Recent price growth is retesting 12-month median highs. On the ground, I’m certainly feeling a new wave of sales and strong pricing here in the Gables.
Median Time to Closed Sale


Observations:
- The median time on market to a closed sale has remained within a fairly consistent range (between two to three months). Compared to Miami-Dade County and South Florida, for that matter, this has been among the quickest categories of property to the closing table. Most luxury sellers should expect 4–6 months on the market with realistic pricing goals. This data demonstrates and reinforces that there is still strong demand for Coral Gables luxury SFHs by beating those expectations.
Active Inventory
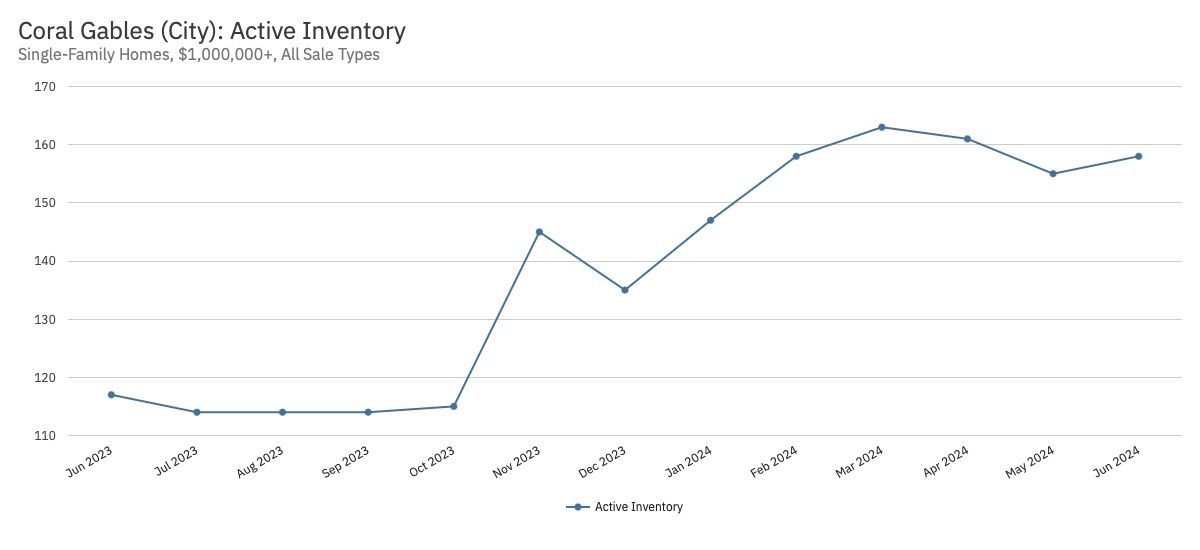

Observations:
- Following national, regional, and local trends, active inventory is up considerably this year, with a recent leveling off. This is reflected in both nominal listings as well as YoY change (with the last five months up from the prior year). To me, this reflects pent-up demand from luxury SFH sellers looking for the right macro and local environment to sell after a few years on the sidelines.
New Listings


Observations:
- Following national, regional, and local trends, new listing inventory of luxury SFHs in Coral Gables is trending up this year, with consistently added inventory each month (six of the last eight months seeing positive change YoY).
Months of Supply

Observations:
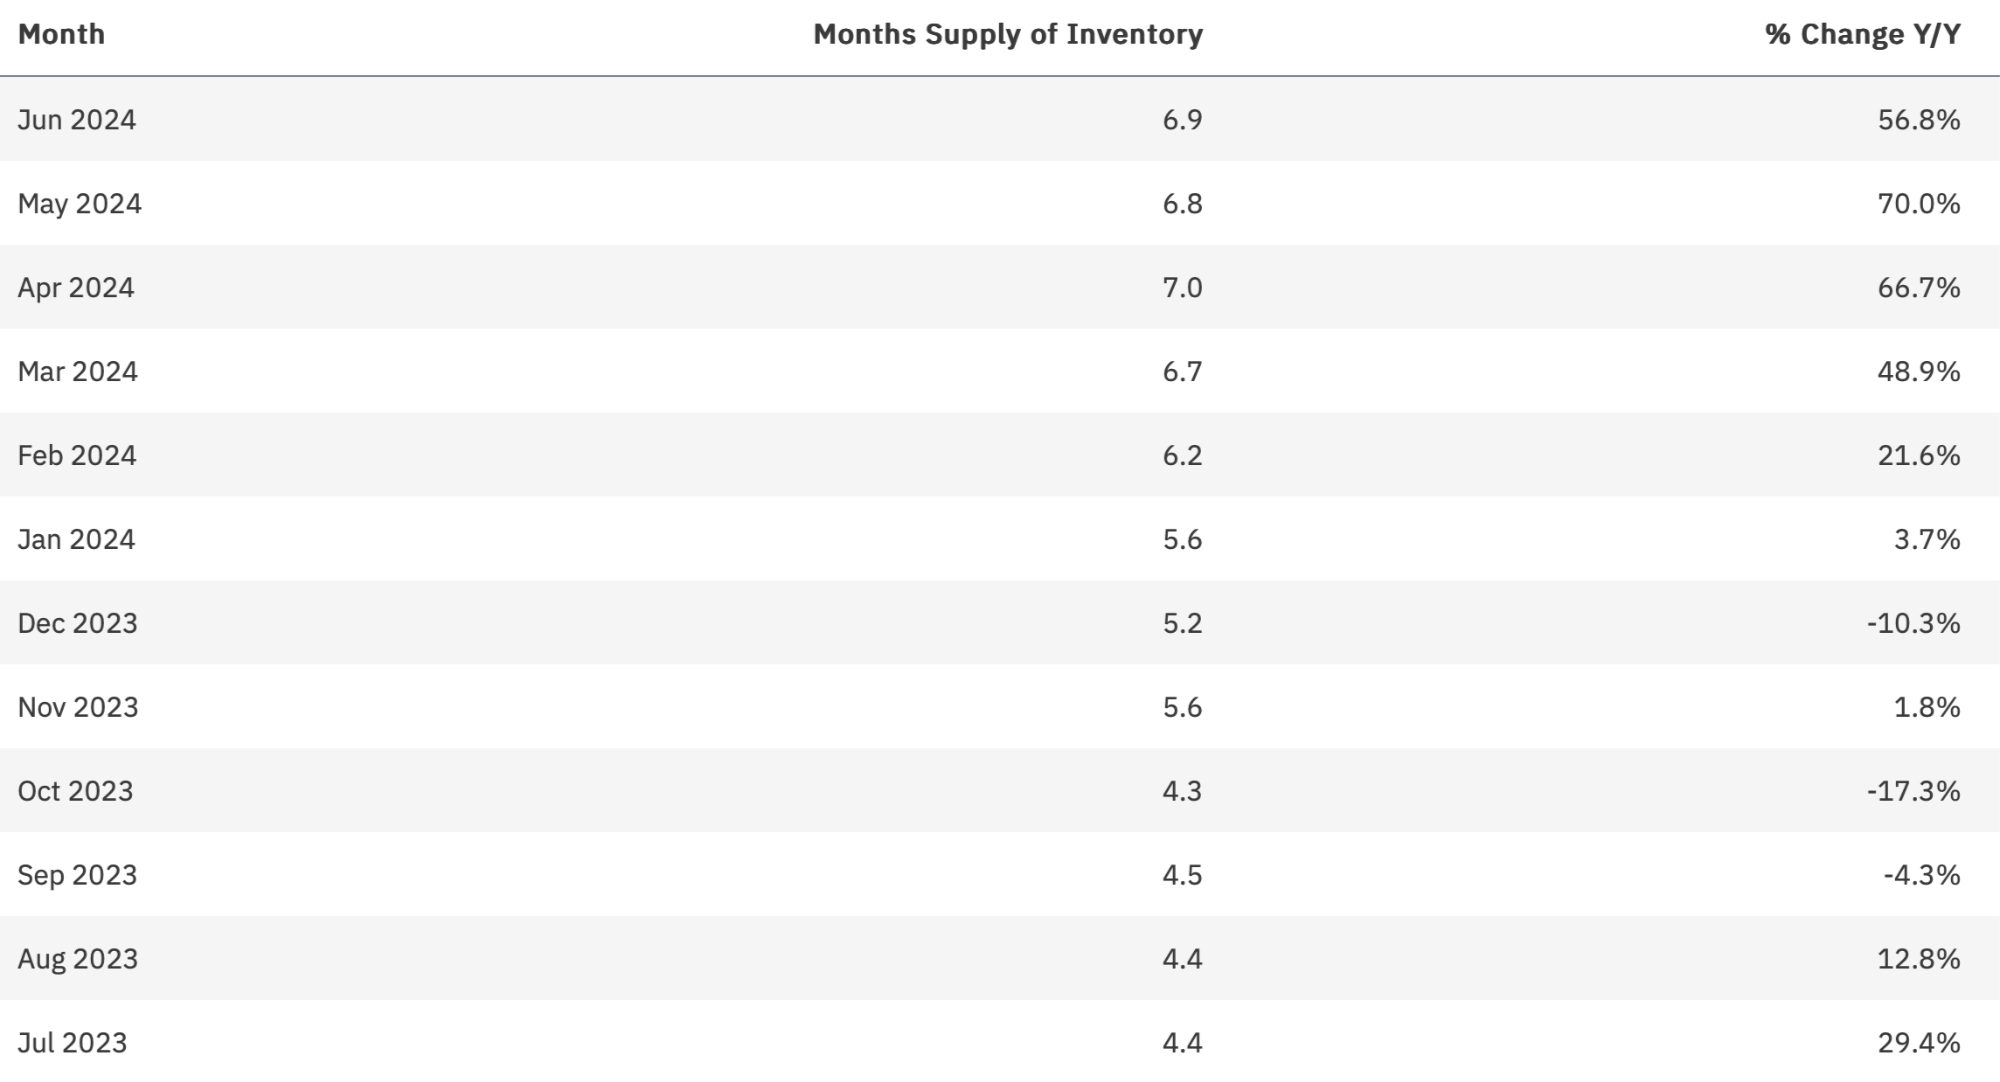
- Months of Supply is another way of looking at the health of the market (buyers, sellers, or neutral). Following national, regional, and local trends, supply is up considerably this year, with consistently added luxury SFH inventory each month. This is reflected in both nominal listings as well as YoY change (especially since January). For this property type, the data indicates it’s between a neutral to buyers’ market, and I find that consistent with what I’m seeing on the ground in Coral Gables. That said, please note that supply is notably lower compared to many other luxury communities within Miami-Dade and South Florida overall.
II. Condos and Townhouses
View Available ListingsSnapshot
Closed Sales

Observations:
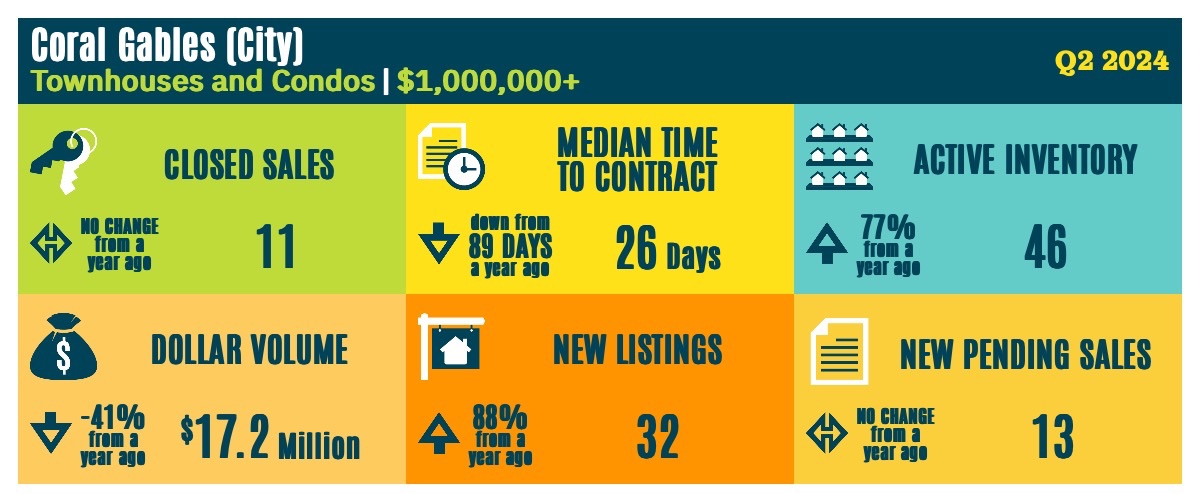
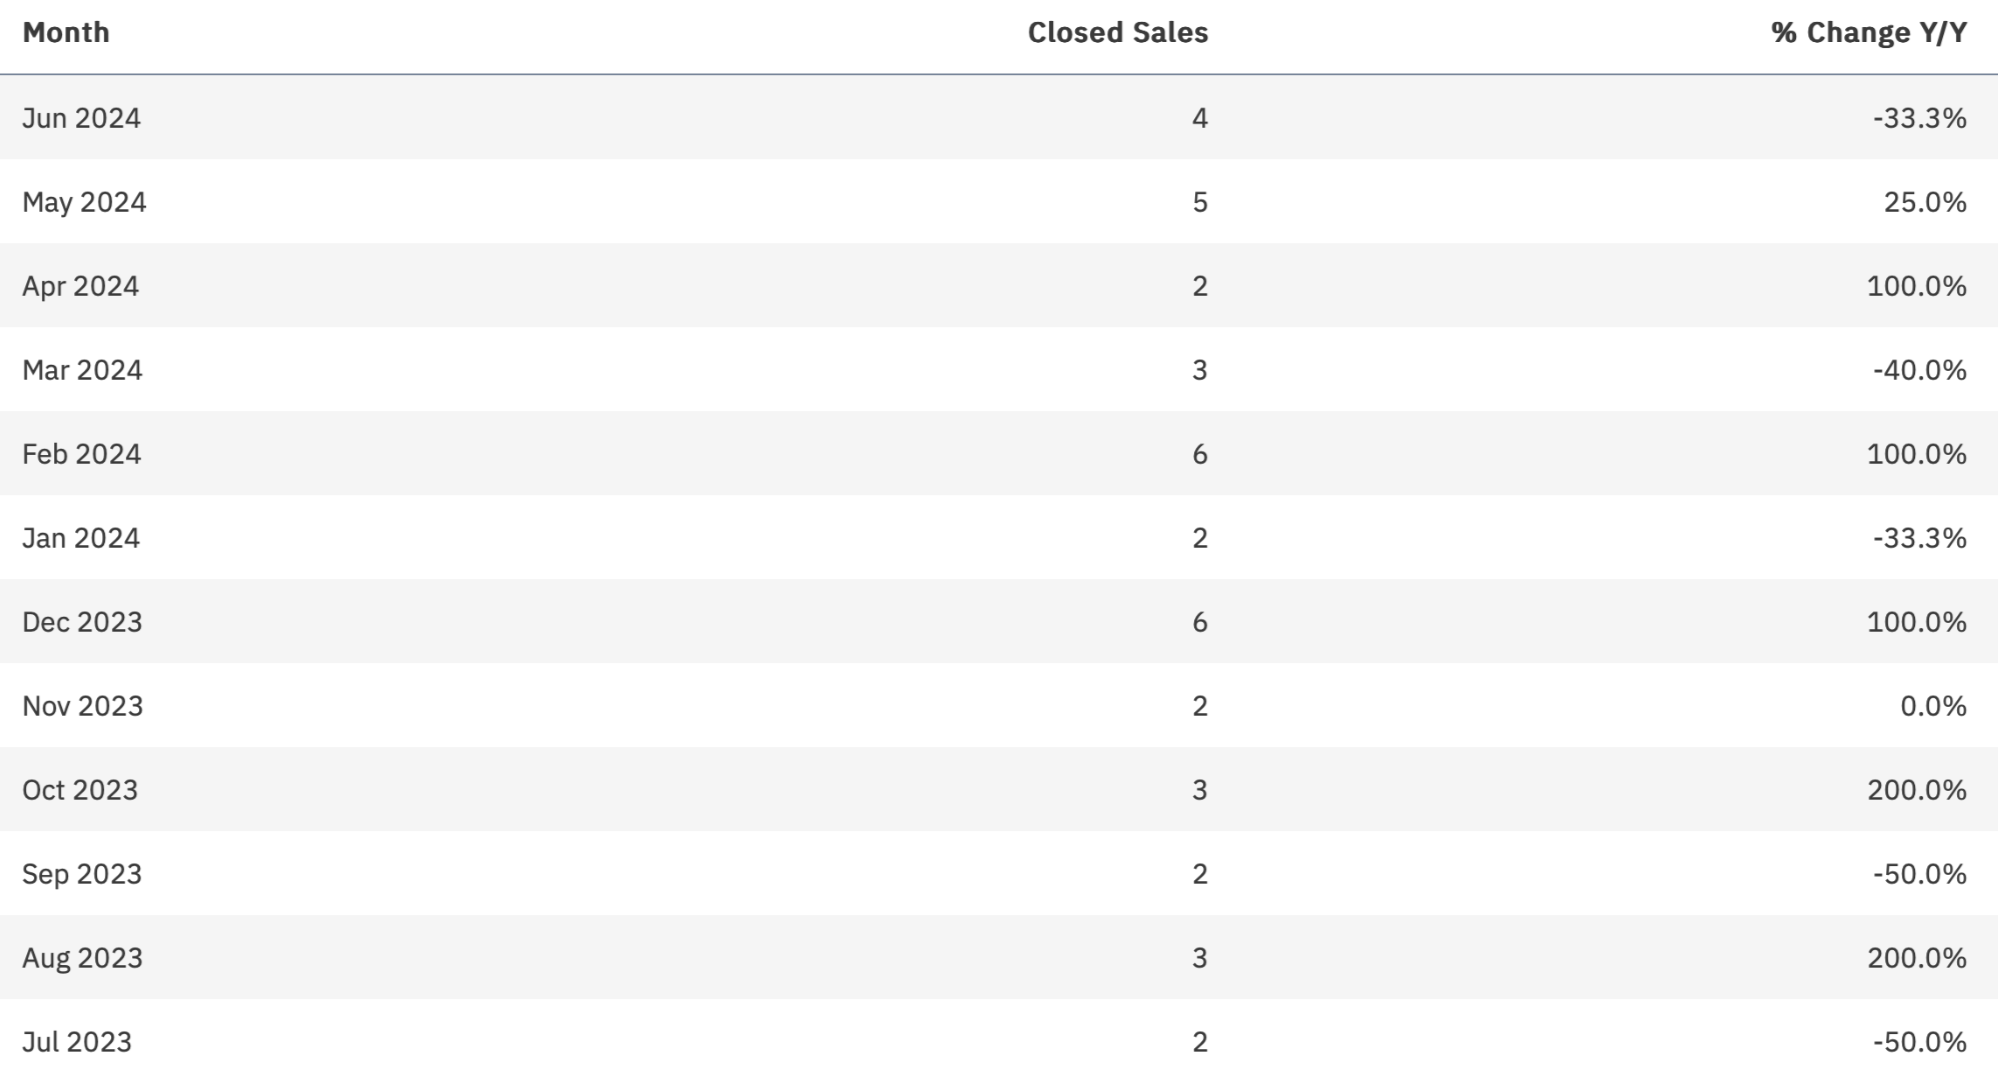
- Given the small market size compared to luxury SFHs in Coral Gables, closed sales of luxury townhouses / condos have fluctuated within a fairly consistent range. Also, due to the small sample size, the YoY change can appear a bit dramatic.
Total Dollars Closed


Observations:
- Given the small market size compared to SFHs in Coral Gables, closed sales dollars of townhouses/condos have fluctuated within a fairly consistent range, with a few months of notable highs. Due to the small sample size, theYoY change can appear a bit dramatic.
Median Sales Price


Observations:
- The median sales price of Coral Gables luxury townhouses/condos has generally remained in a fairly consistent range, while YoY change has fluctuated between positive (5 months) and negative (7 months) over the last year, demonstrating relatively flat price growth.
Median Time to Closed Sale


Observations:
- In contrast to luxury SFHs, the median time to a closed sale for this property type has varied significantly at various points throughout the last year. This is consistent in terms of both actual days and YoY change, and once again, it’s likely due to the small market size. That said, 7 of the last 12 months have closed at, around, or below four months on the market.
Active Inventory


Observations:
- Following national, regional, and local trends, inventory is up considerably this year for luxury townhouses / condos in Coral Gables. This is reflected in both nominal listings as well as YoY change (with every month above last year’s mark). Once again, there is no doubt that this is pent-up seller demand “waiting” for “the right time” to make a move with what’s happening in the macro and local economies.
New Listings


Observations:
- Following national, regional, and local trends, new listing inventory is up considerably this year for Coral Gables luxury townhouses / condos, with consistently added inventory each month. This is reflected in both nominal listings as well as YoY change and represents a release of pent-up seller demand to move property. It's interesting to note that even with the increased supply of new listings, median sales pricing has remained steady, reflecting demand for the limited opportuniteis in this property type.
Months of Supply
Observations:
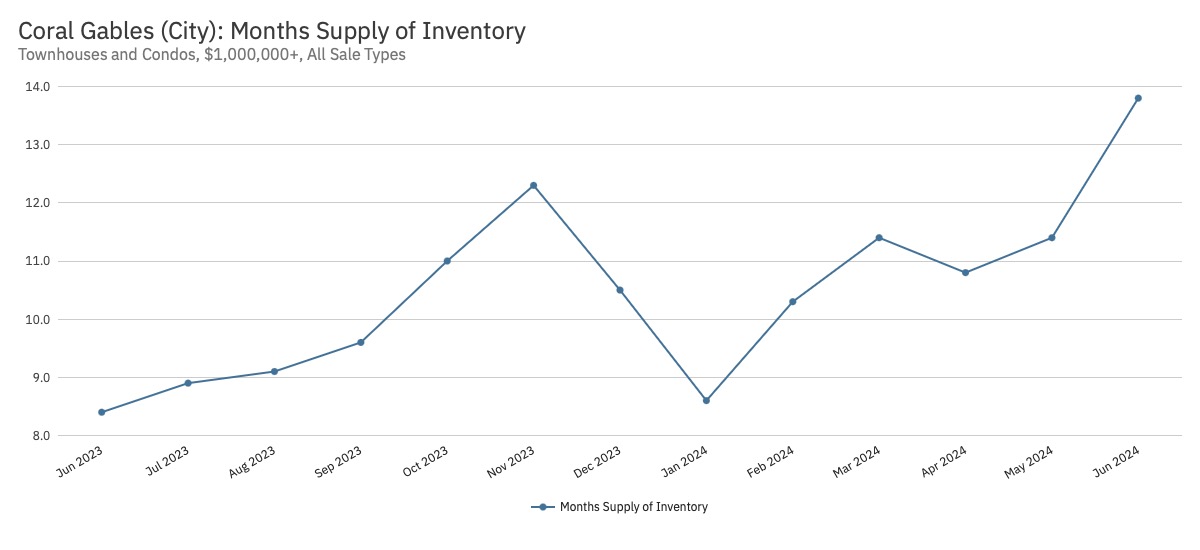
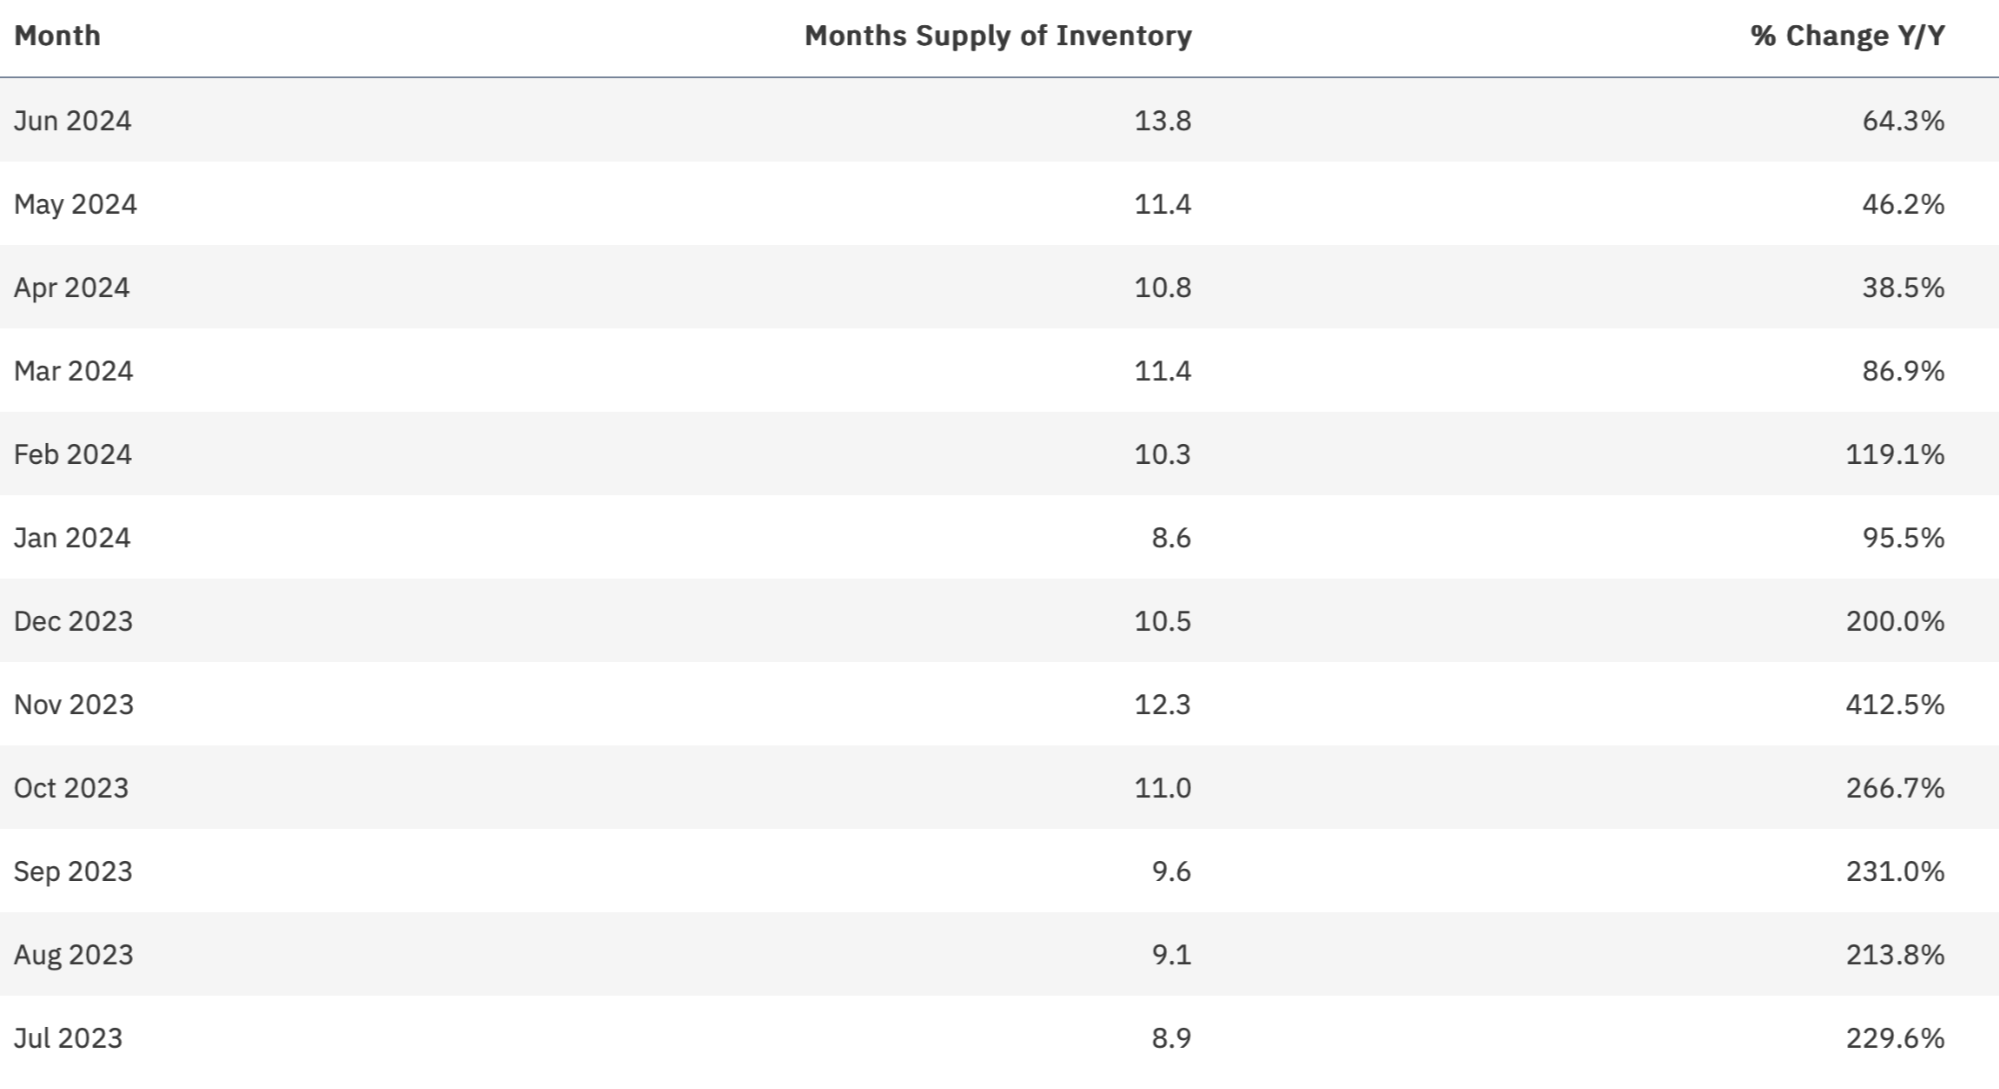
- Months of Supply is another way of looking at the health of the market (buyers, sellers, or neutral). Following national, regional, and local trends, the supply of Coral Gables luxury townhouse / condo inventory is up considerably this year, with consistently added inventory each month. This is reflected in both nominal listings as well as YoY change. It has become an undoubtedly buyers’ market with double-digit supply, yet steady median pricing and quick timelines on the market suggest deals are getting done without major price cuts.
COCONUT GROVE (MIAMI)
I. Single Family Homes (SFHs)
View Available ListingsSnapshot

Closed Sales

Observations:
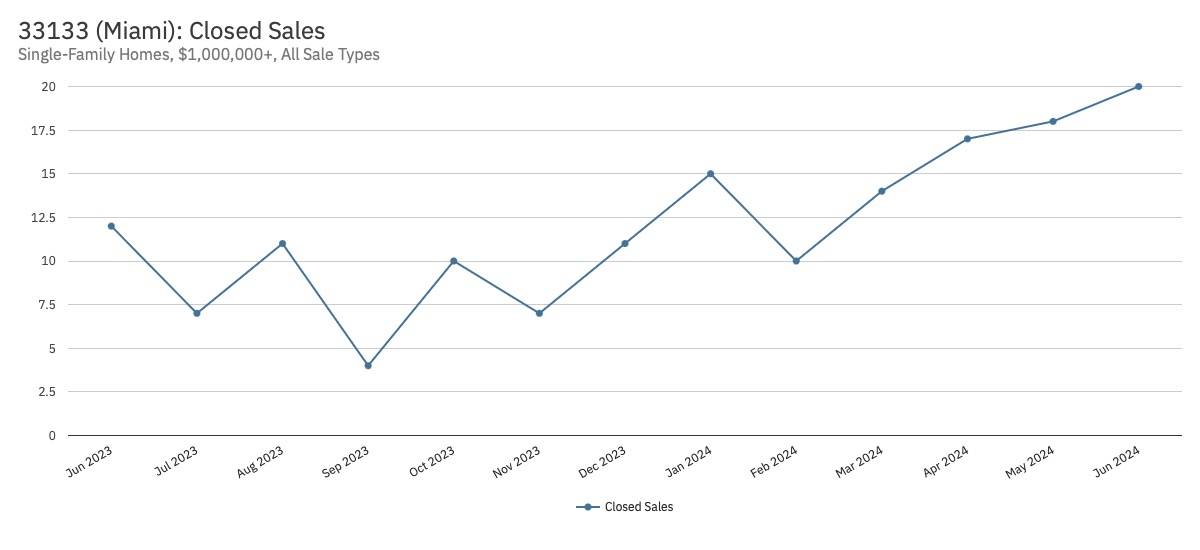
- Closed sales of Coconut Grove luxury SFHs are trending up this year both in terms of transactions and YoY change (with six of the last seven months up compared to last year). This reflects the strong demand for homes in the Grove and the desire to sell. Deals are getting done in one of the most coveted markets of Miami-Dade and all of South Florida.
Total Dollars Closed


Observations:
- While closed sales dollars are trending up in volume this year, with a notably high June, the YoY change has seen both positive (8 up) and negative (7 down) fluctuations. Given that the number of sales transactions is also trending upwards (at a higher rate), this likely reflects some price depreciation per unit transaction, albeit with a few notably high sales that have been publicized within the Grove.
Median Sales Price


Observations:
- The median sales price of luxury SFHs in Coconut Grove has decreased from highs about a year ago but has stabilized within a steady range heading into summer. YoY change has seen an even number of up and down months. Median sale prices are still among the highest in Miami-Dade County.
Median Time to Closed Sale


Observations:
- For luxury SFHs in Coconut Grove, the median time on market to a closed sale has been relatively quick over the last year, except for a few outlier months. Most months beat the expected 4–6 month period recommended for luxury SFHs. It appears deals are getting done due to strong demand and realistic pricing.
Active Inventory


Observations:
- Following national, regional, and local trends, active inventory is up considerably this year. This is reflected in both nominal listings as well as YoY change. Once again, I attribute this to pent-up seller demand releasing due to the macro and local economic environments over the last few years.
New Listings


Observations:
- Following national, regional, and local trends, new listing inventory for luxury SFHs in Coconut Grove is up considerably this year, with consistently added inventory each month. This is reflected in both nominal listings as well as YoY change.
Months of Supply

Observations:
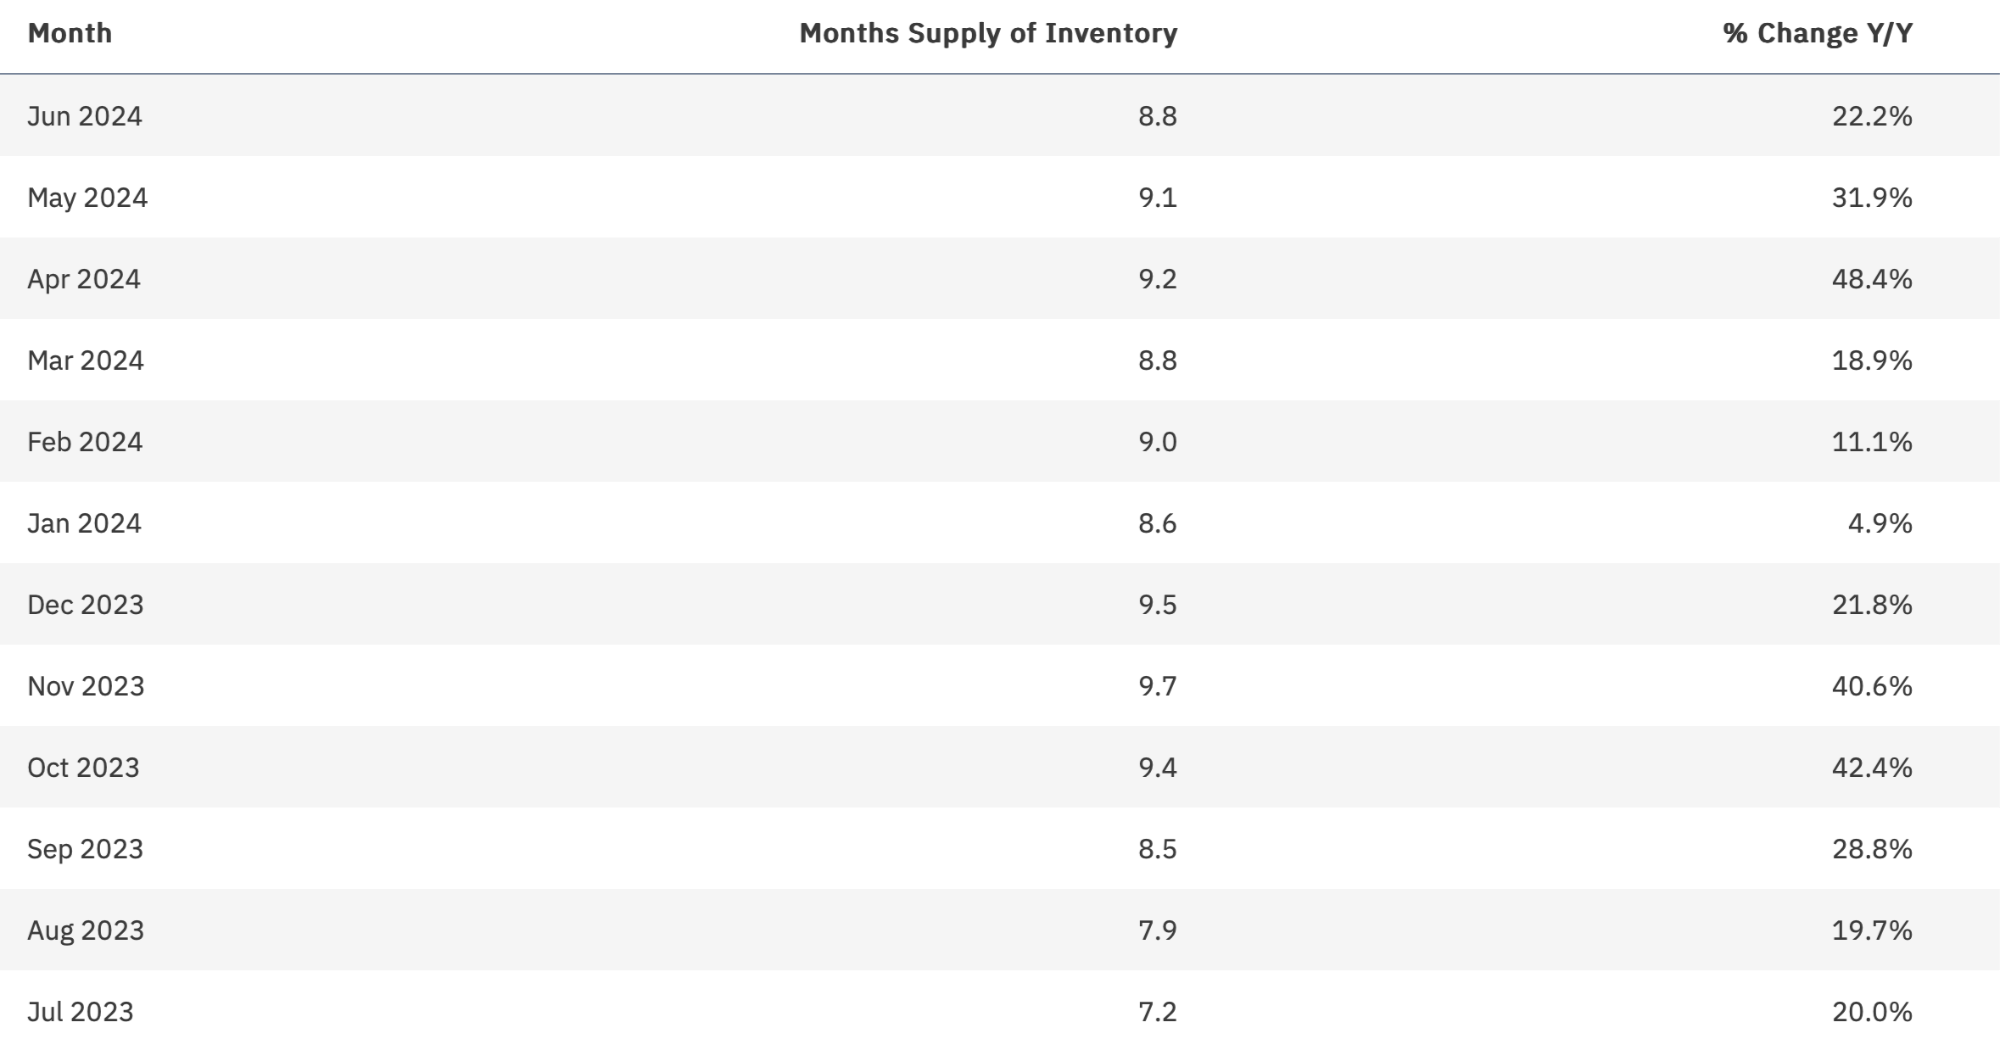
- Months of Supply is another way of looking at the health of the market (buyers, sellers, or neutral). Following national, regional, and local trends, the supply of inventory is up considerably this year, with consistently added inventory each month. This is reflected in both nominal listings as well as YoY change. However, absorption has remained fairly steady while maintaining median sales prices and time on the market. For luxury SFHs in Coconut Grove, the data suggests it’s a buyers’ market, but I find it still relatively balanced.
II. Condos and Townhouses
View Available ListingsSnapshot

Closed Sales


Observations:
- Closed sales of Coconut Grove luxury townhouses / condos are fluctuating within a relatively consistent range. However, YoY change is up considerably over the last 12 months. This reflects the strong demand for this product type in the Grove and the desire to sell. Deals are getting done in one of the most coveted markets of Miami-Dade and all South Florida.
Total Dollars Closed


Observations:
- While closed sales dollars are trending down recently and from a high seen last year, monthly volume has fluctuated within an established range. YoY change has seen all but two months trade higher than a year ago.
Median Sales Price

Observations:
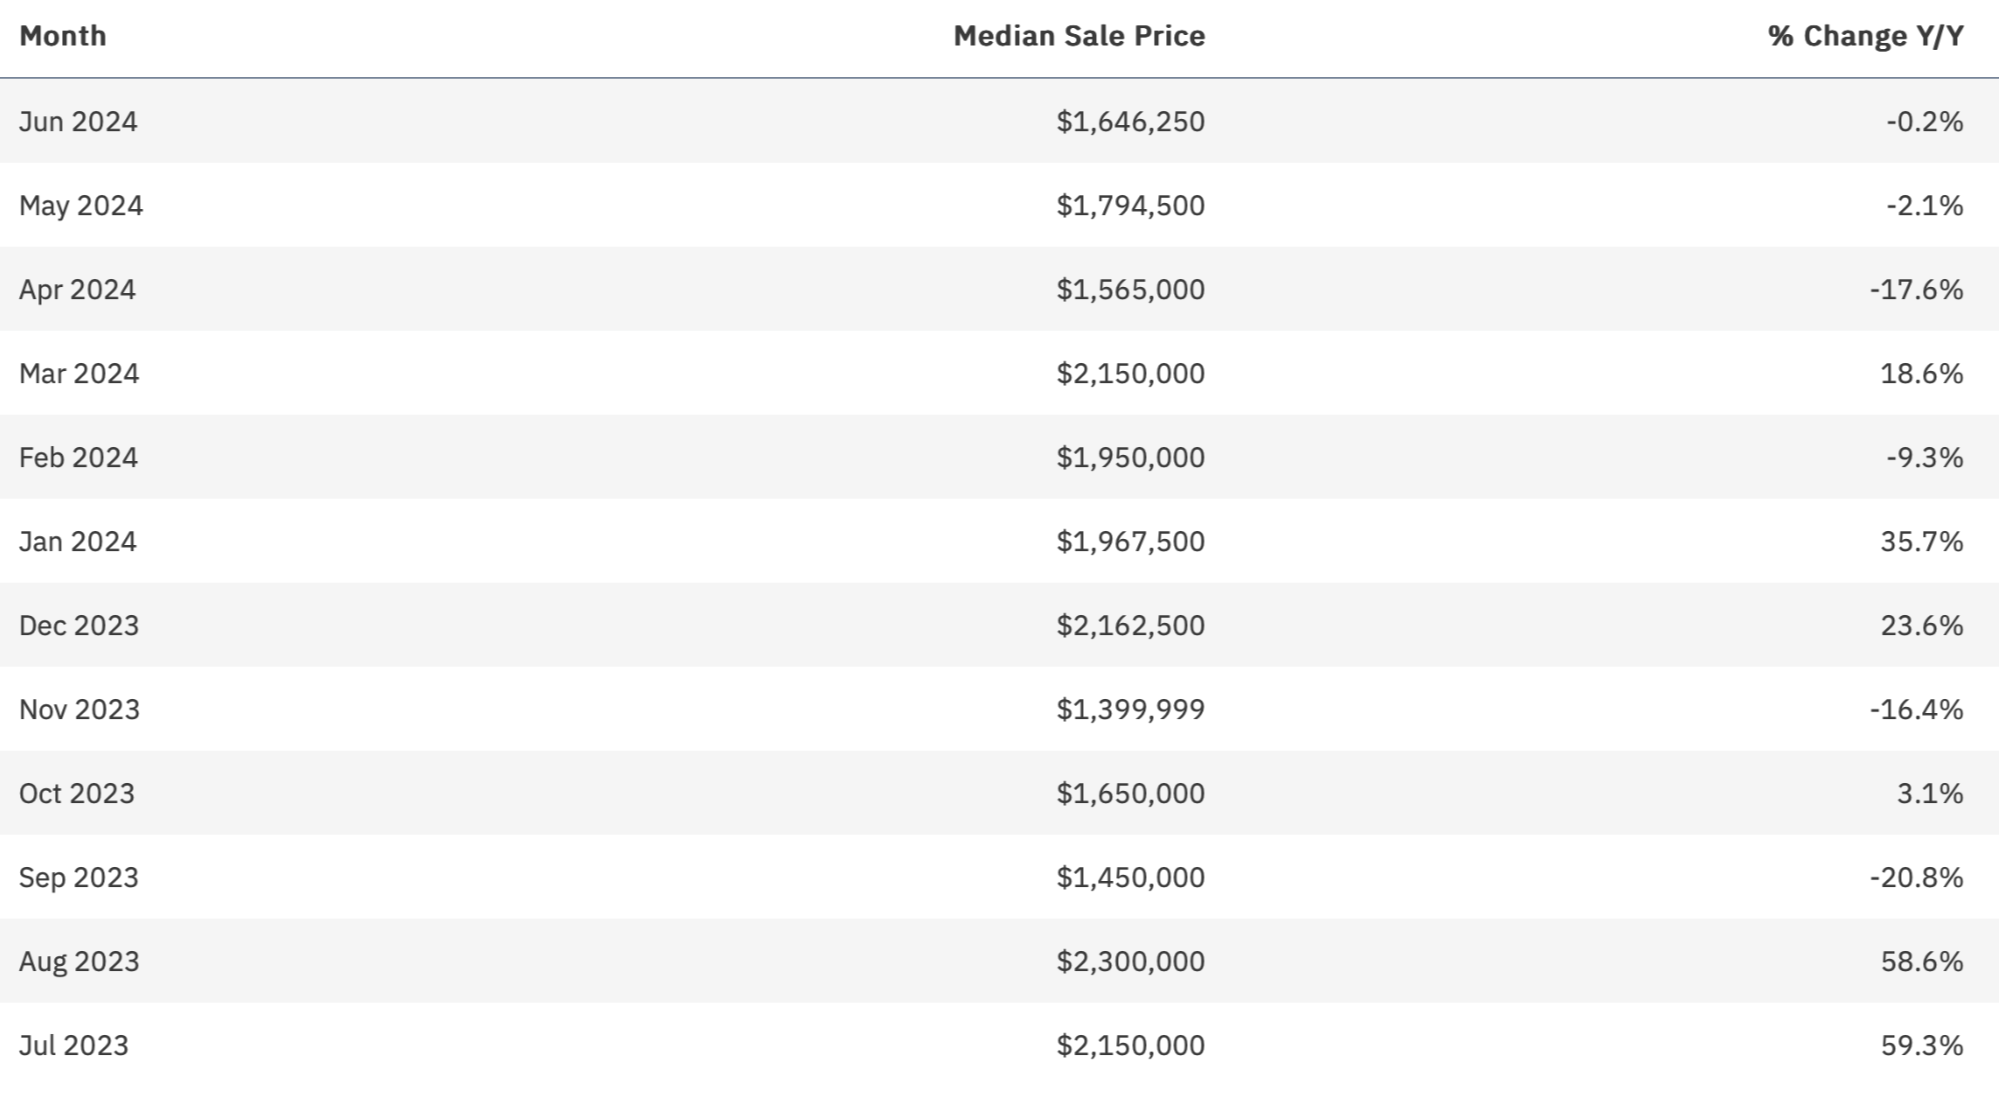
- The median sales price for luxury townhouses / condos in Coconut Grove has decreased this calendar year, in line with pricing seen last fall. The trading range has been notably lower than recent highs. Given higher sales volume (transactions and dollars), this suggests sellers are adjusting pricing to get deals done.
Median Time to Closed Sale

Observations:
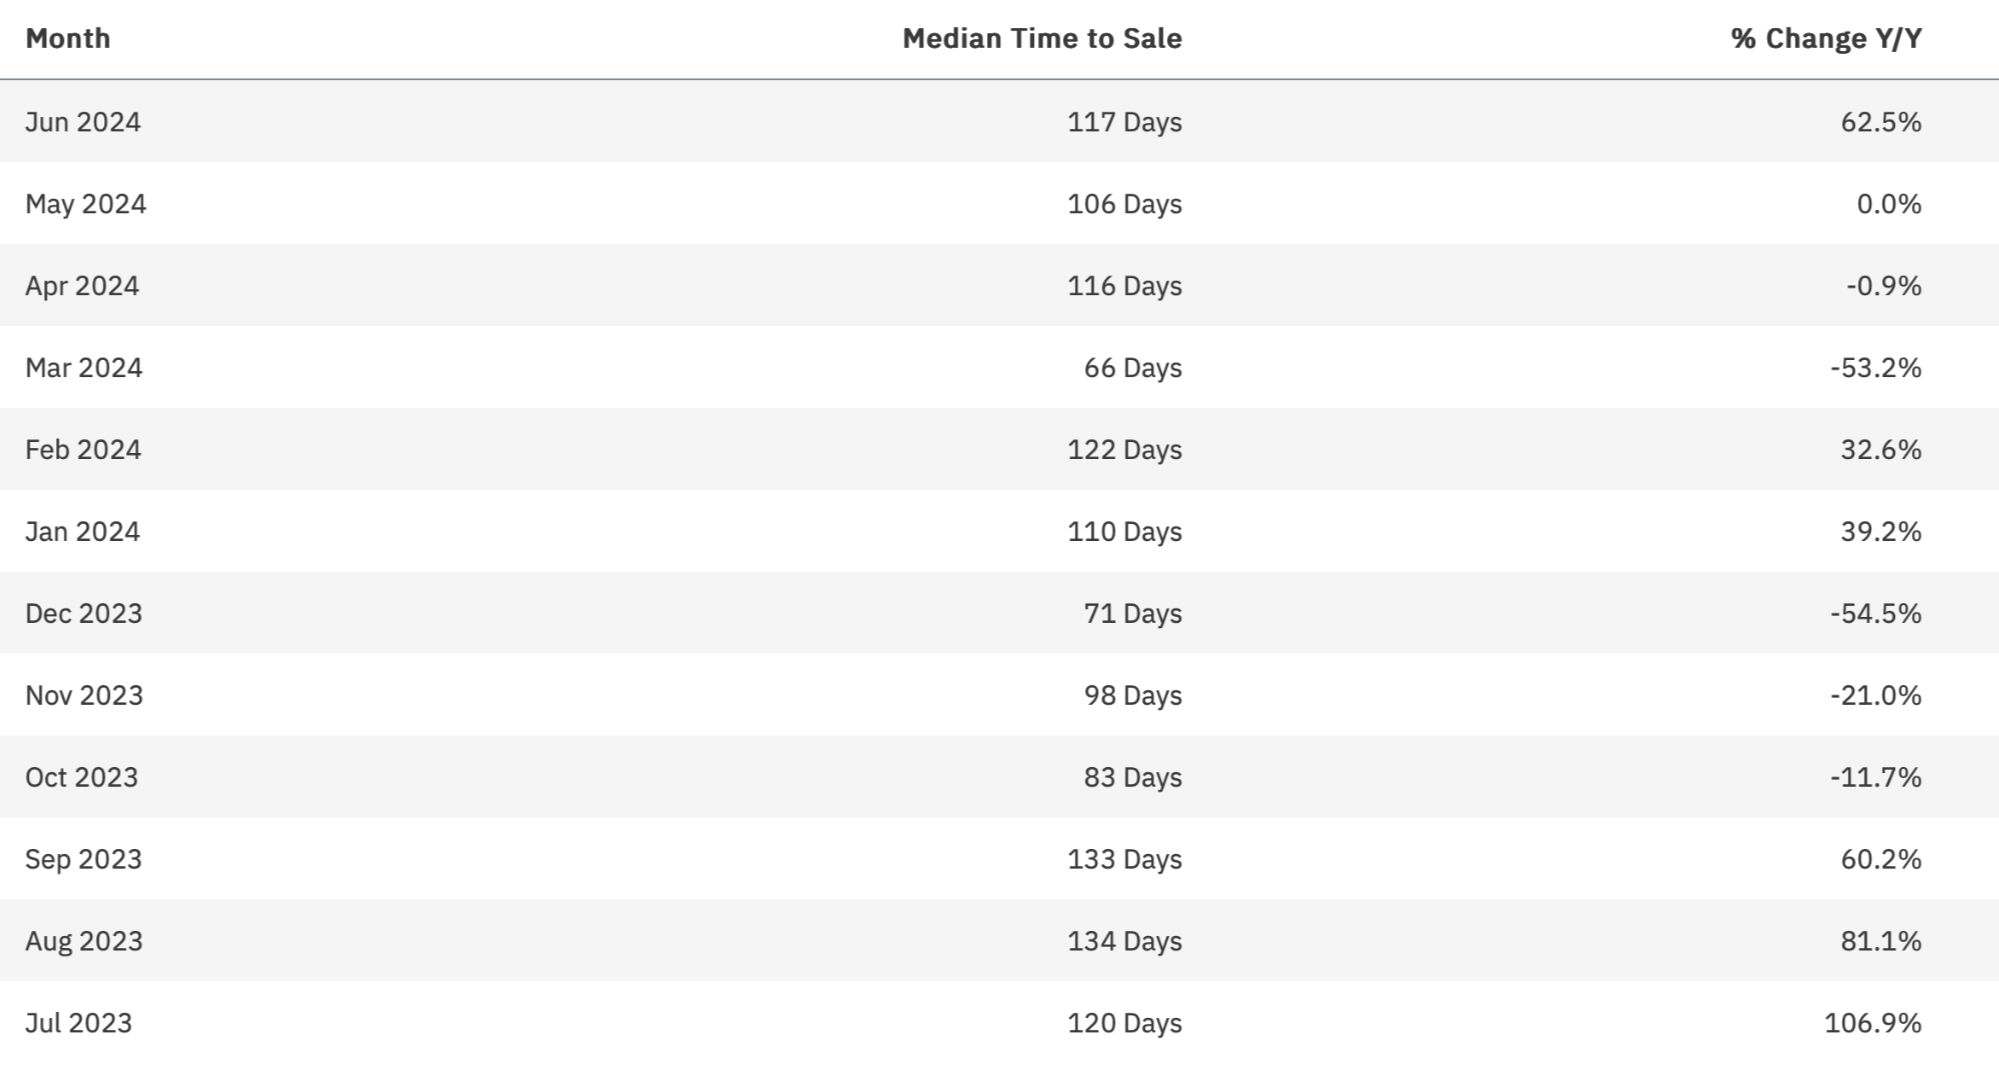
- The median time on market to a closed sale for this property type has exceeded 100 days in five out of the last six months. The median time to the closing table is still faster than in many South Florida markets for luxury townhouses /condos but is slower than that of luxury SFHs within Coconut Grove.
Active Inventory

Observations:
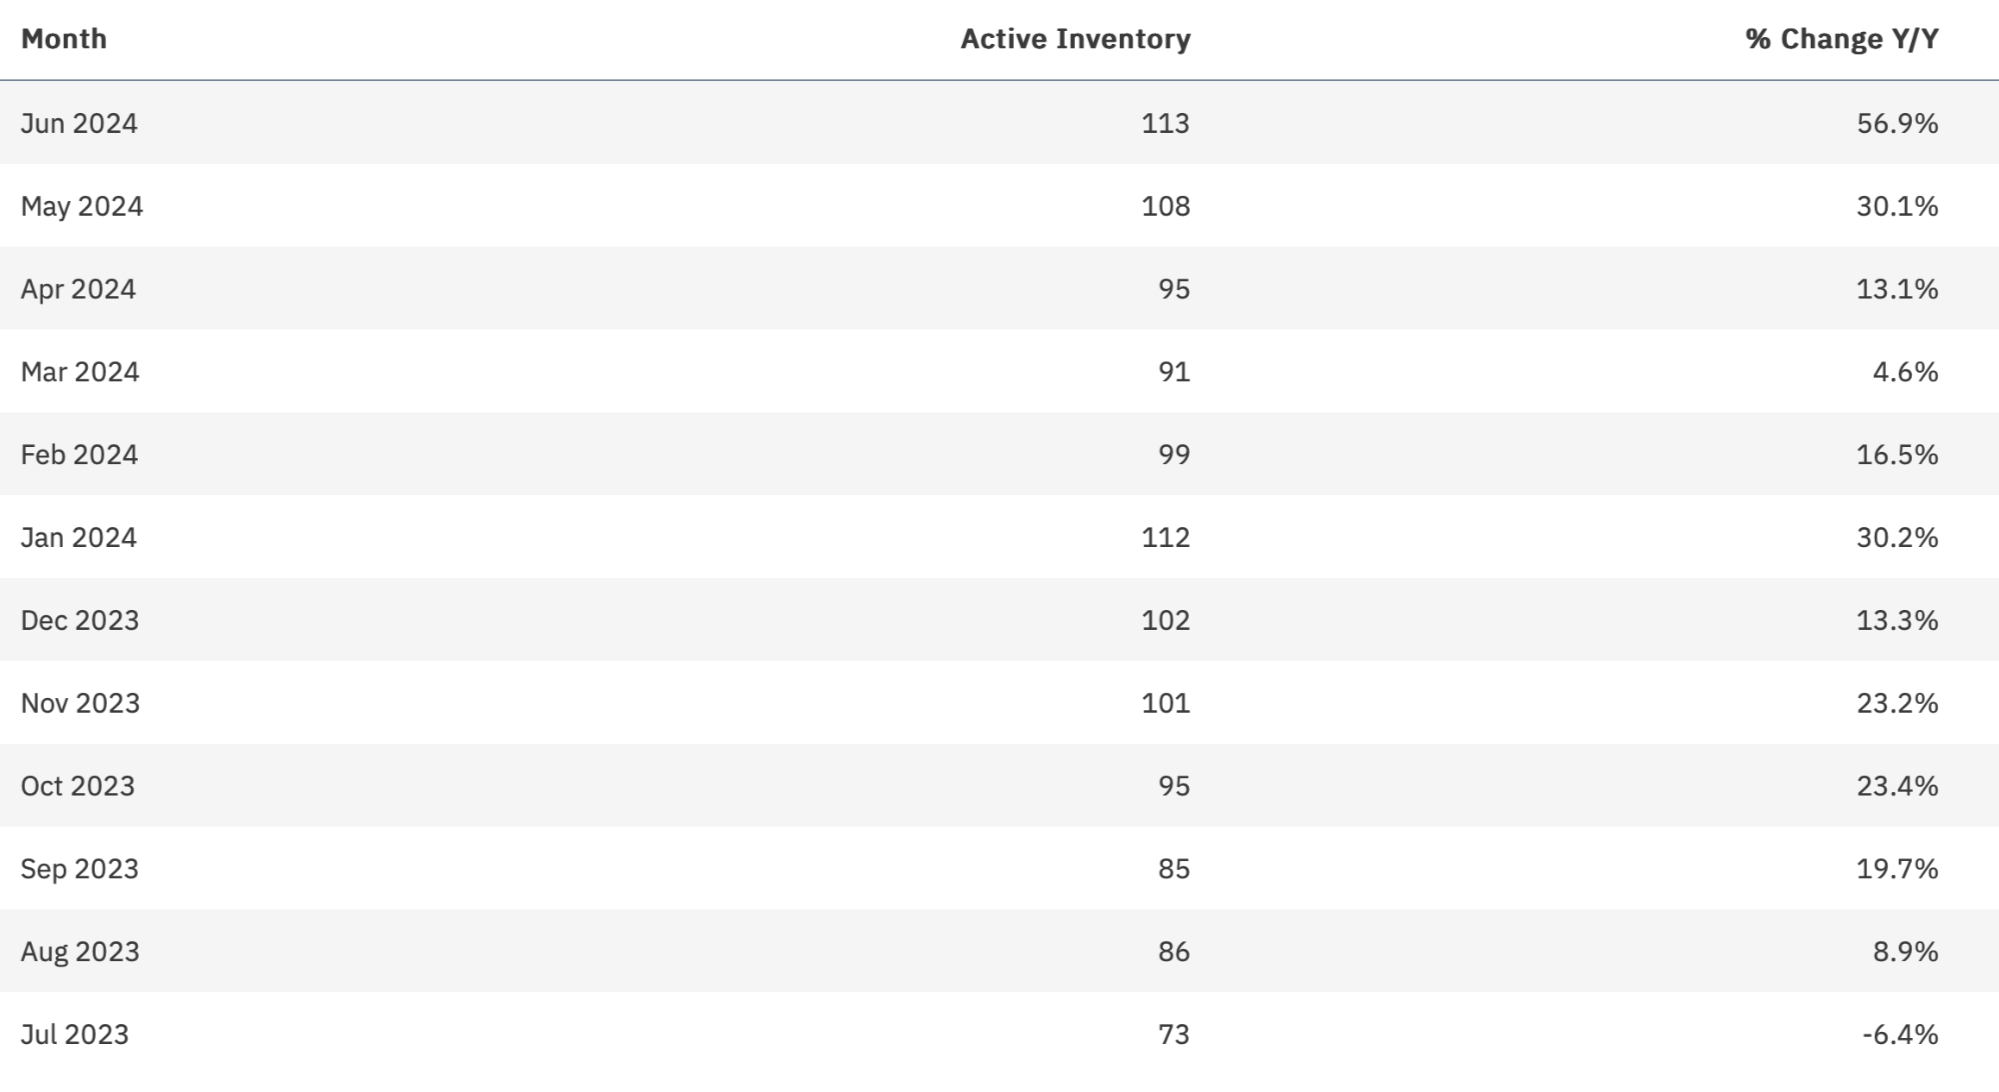
- Following national, regional, and local trends, active inventory is up again considerably after a Q1 drop. This is reflected in both nominal listings as well as YoY change (with all but one month higher than the prior year). Once again, I attribute this to pent-up seller demand releasing due to the macro and local economic environments over the last few years.
New Listings


Observations:
- Following national, regional, and local trends, new listing inventory is trending up this year with consistently added inventory each month, though with a drop heading into summer. This is reflected in both nominal listings as well as YoY change, where 9 out of the last 12 months have seen more new listings than the prior year.
Months of Supply


Observations:
- Months of Supply is another way of looking at the health of the market (buyers, sellers, or neutral). Following national, regional, and local trends, the supply of inventory is up this past Q2, with consistently added inventory each month following a period of strong absorption this past spring / Q1. For this property type, the data indicates it’s a buyers’ market, and you can feel some softness here in the Grove. This net increase in inventory is resulting in a recent drop in the median sales price for luxury townhouses / condos.
KEY BISCAYNE
I. Single Family Homes (SFHs)
View Available ListingsSnapshot

Closed Sales

Observations:
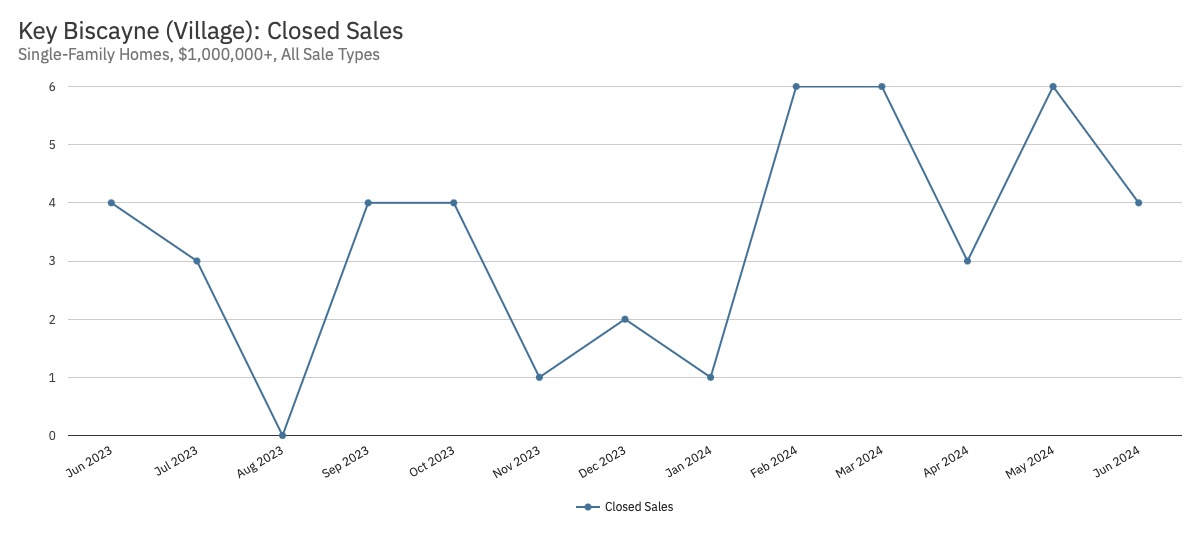
- Closed sales of Key Biscayne luxury SFHs are trending up this year in terms of volume and YoY change (although we’re dealing with a relatively small sample size that can amplify the rate of change).
Total Dollars Closed

Observations:
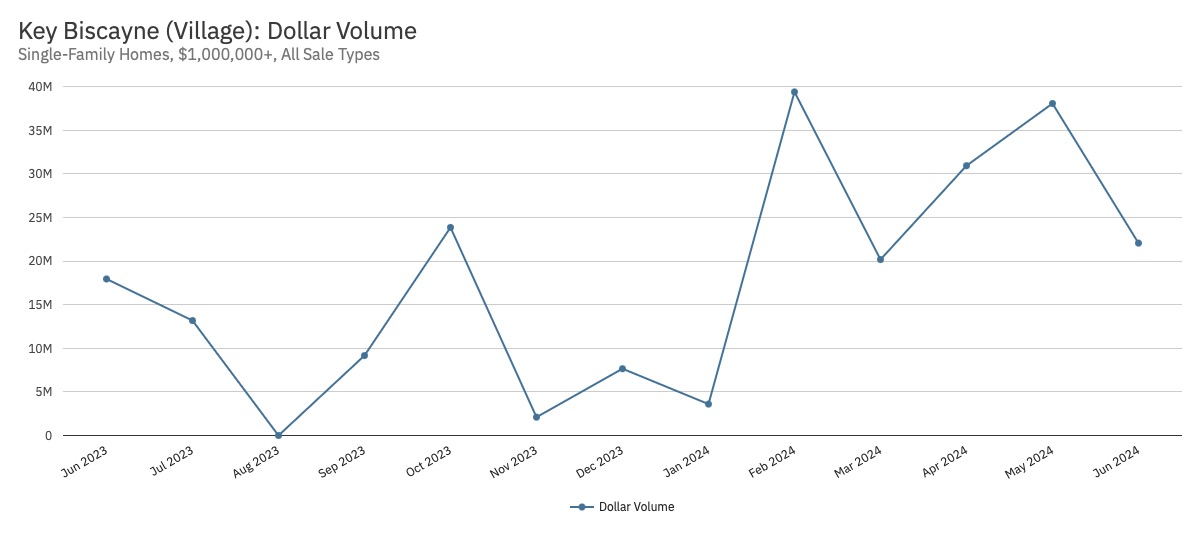
- While closed sales dollars for Key Biscayne luxury SFHs are trending up in volume this year, with two notably high months, the YoY change has seen both positive and negative fluctuations (7 up and 5 down). Compared to the number and value of homes actually in the village, it’s a notably low-selling market compared to other luxury communities in South Florida.
Median Sales Price

Observations:
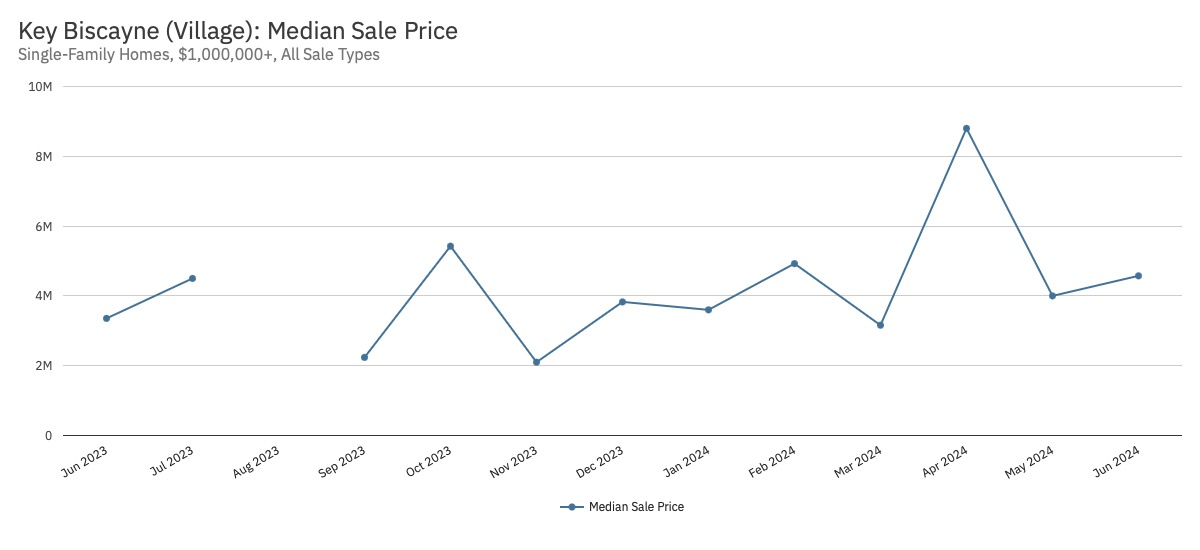
- The median sales price of luxury SFHs in Key Biscayne has been fairly flat (except for a significant high in April 2024). There have been 8 combined down-to-flat months YoY. That said, median sales pricing is among some of the highest in Miami-Dade County, with relatively low transactions and dollar volume.
Median Time to Closed Sale

Observations:
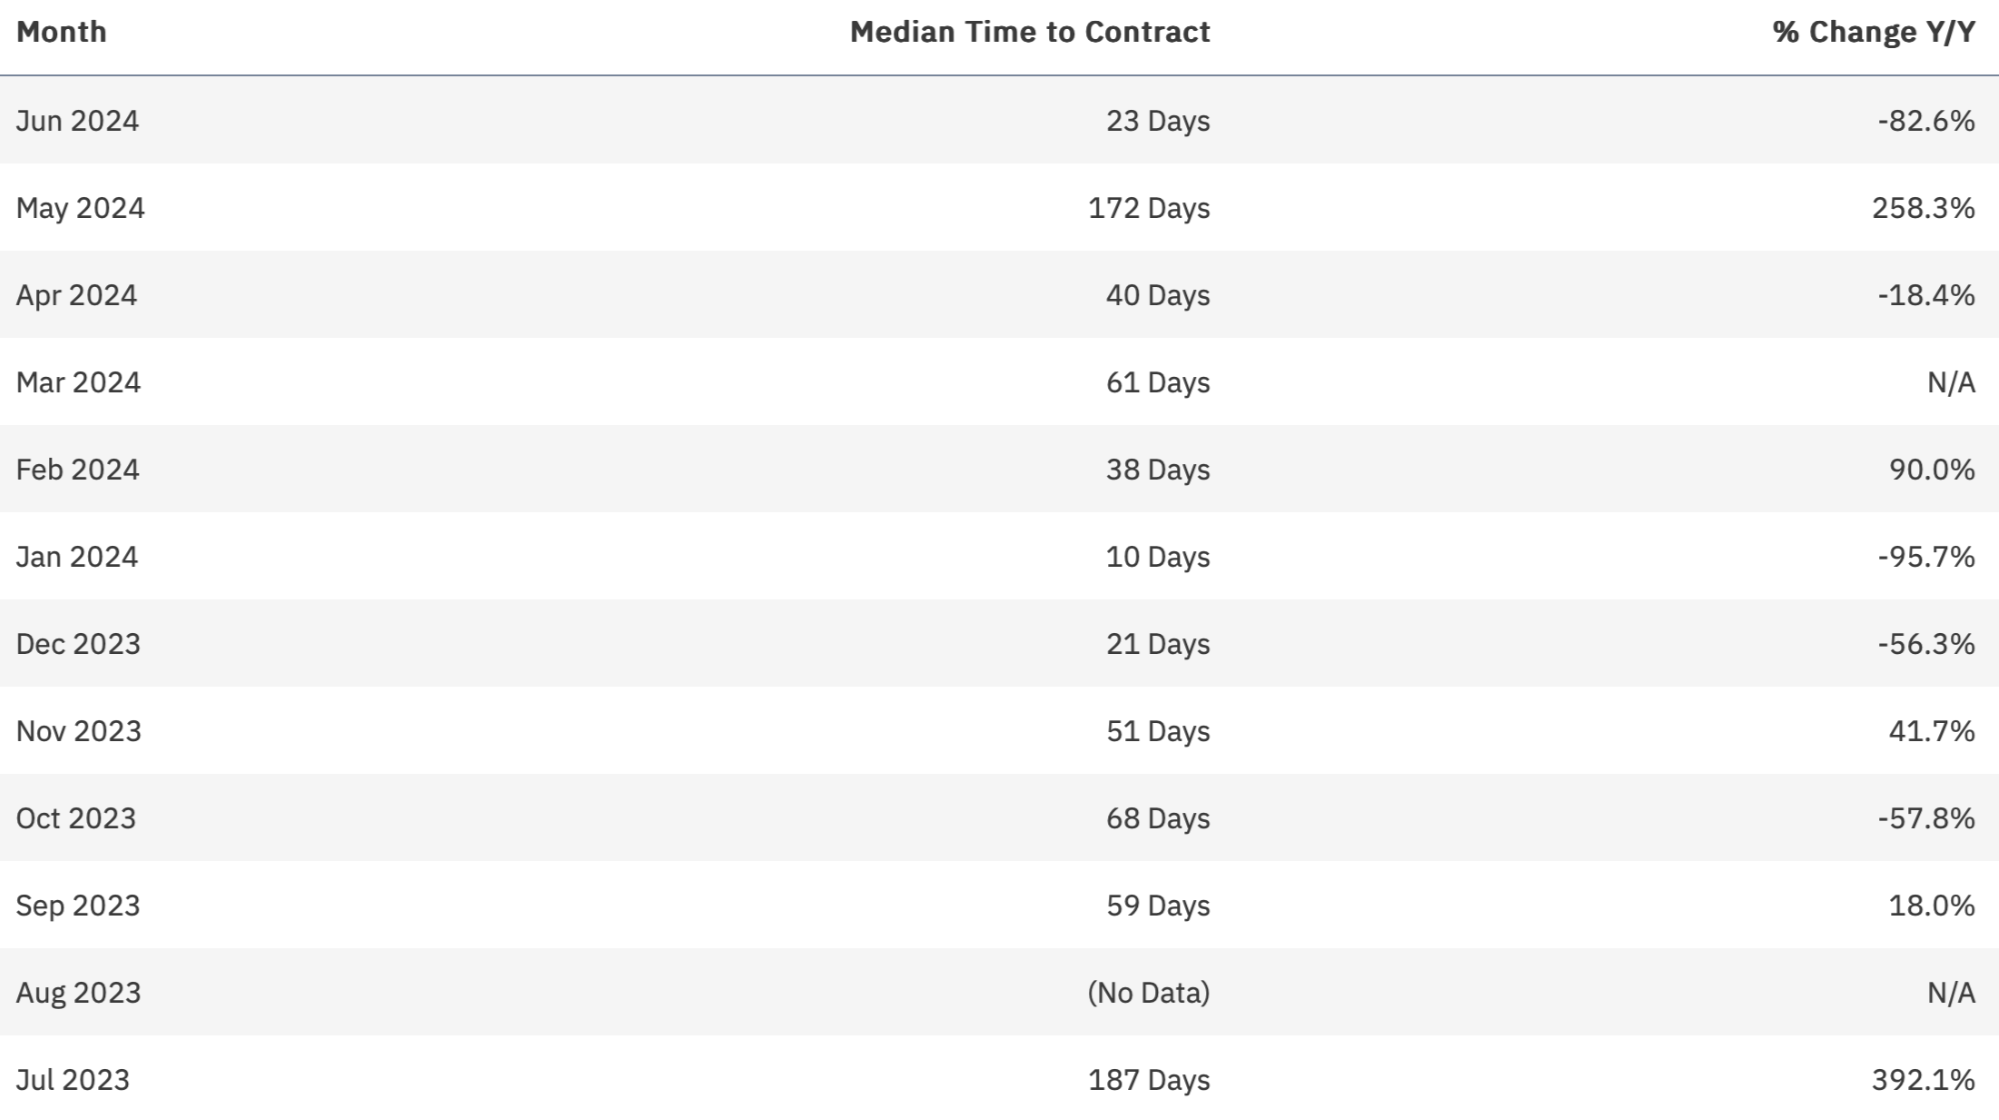
- The median time on market to a closed sale within Key Biscayne has been very quick compared to other luxury SFH markets. This demonstrates a strong alignment between sellers and buyers, with a willingness to close when rare inventory becomes available.
Active Inventory


Observations:
- Bucking the national, regional, and local trends, active inventory has been dropping for SFHs in this luxury market, with most months seeing fewer listings than the year before. There is still a fairly consistent range of gross listings active on the market when analyzing the last 12 months.
New Listings

Observations:
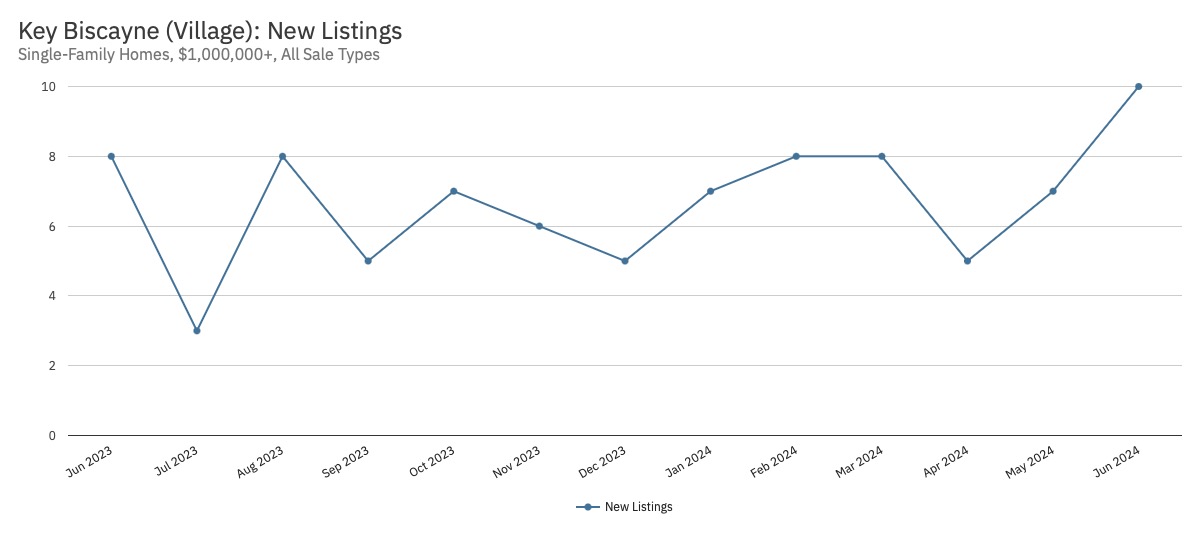
- Bucking the trends, new inventory has been dropping for luxury SFHs in this market, with 6 months seeing fewer listings than the year before. That said, even with a relatively low sample size, there is a fairly consistent range of new homes hitting the market, with a 12-month high as recent as June entering the summer relocation season.
Months of Supply


Observations:
- Months of Supply is another way of looking at the health of the market (buyers, sellers, or neutral). Contrary to national, regional, and local trends, the supply of luxury SFH inventory is trending down consistently this year within Key Biscayne (following a surge of inventory last year). For this property type, the data suggests it’s a buyers’ market, but I’ll tell you it truly feels like a neutral-to-sellers’ market, and the numbers are heading that way. All indicators have shown strength for luxury SFHs in Key Biscayne this year as one of the most in-demand communities in Miami-Dade.
II. Condos and Townhouses
View Available ListingsSnapshot

Closed Sales

Observations:
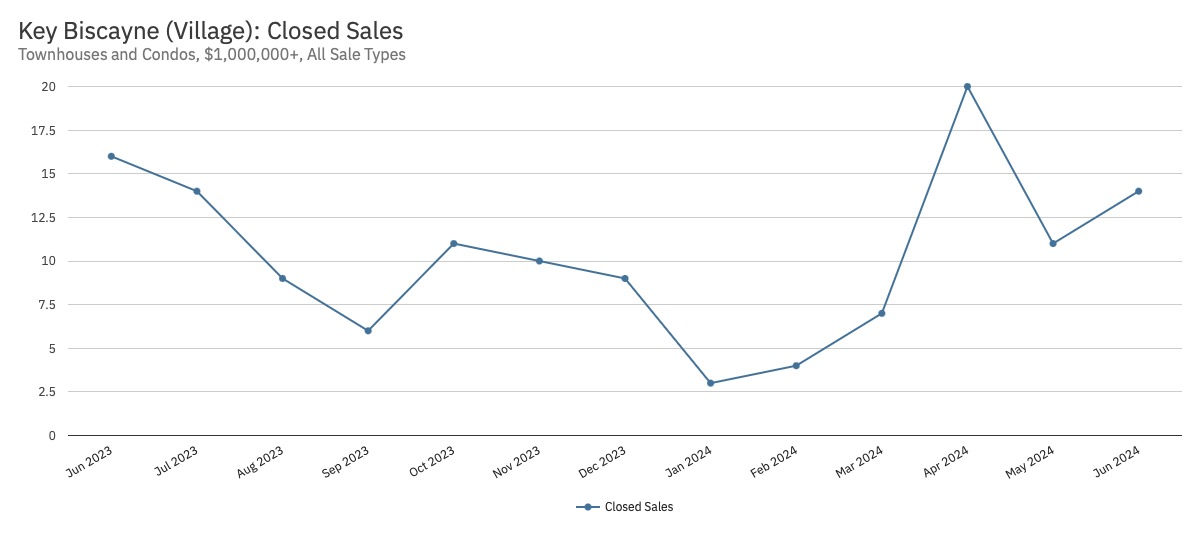
- Closed sales of Key Biscayne luxury townhouses / condos are trending up for the year (with a strong spring into summer season), but 8 of the last 12 months have seen negative YoY change. It feels on the ground like the market is picking up, and the data reflects that (but is down from a year ago).
Total Dollars Closed

Observations:
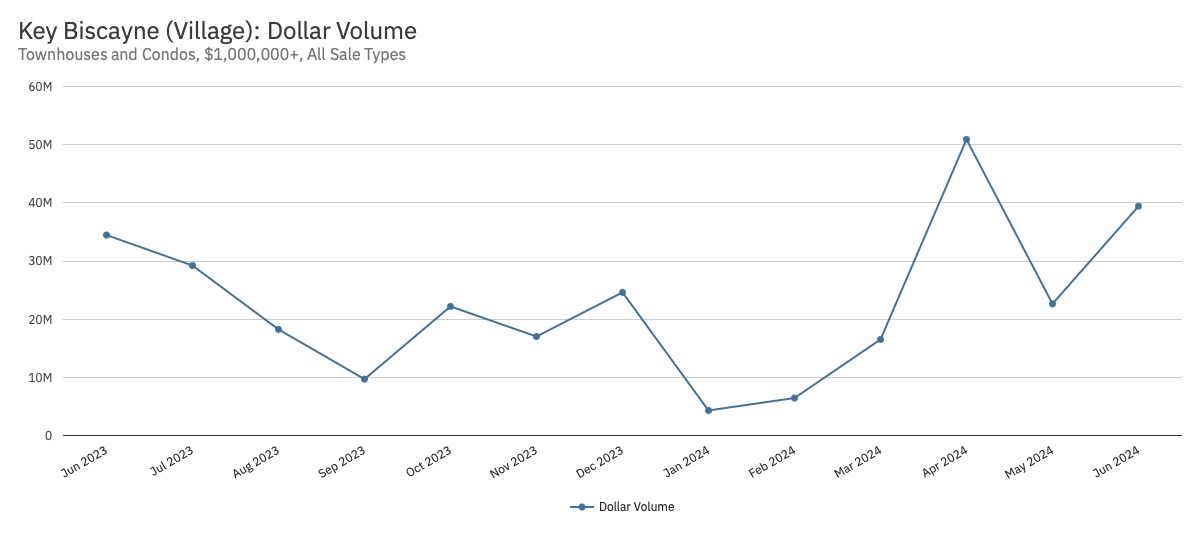
- Similar to the metric above, closed sales dollars of Key Biscayne luxury townhouses/condos are trending up for the year (also with a strong spring into summer season), but 7 of the last 12 months have seen negative YoY change. The on-the-ground feel and data show the market is picking up here.
Median Sales Price


Observations:
- The median sales price of Key Biscayne luxury townhouses/condos has traded within a fairly consistent range over the last year; however, 8 of the last 12 months reflect negative YoY change. Coupled with sales transactions and dollar volume, it’s safe to say it’s been an up-and-down market for this property type.
Median Time to Closed Sale


Observations:
- The median time on market to a closed sale within Key Biscayne has been relatively consistent with other luxury townhouse/condo markets in South Florida. However, the time on market is noticeably higher than for SFHs on the Key. That said, the market is currently trading quicker than recent highs.
Active Inventory

Observations:
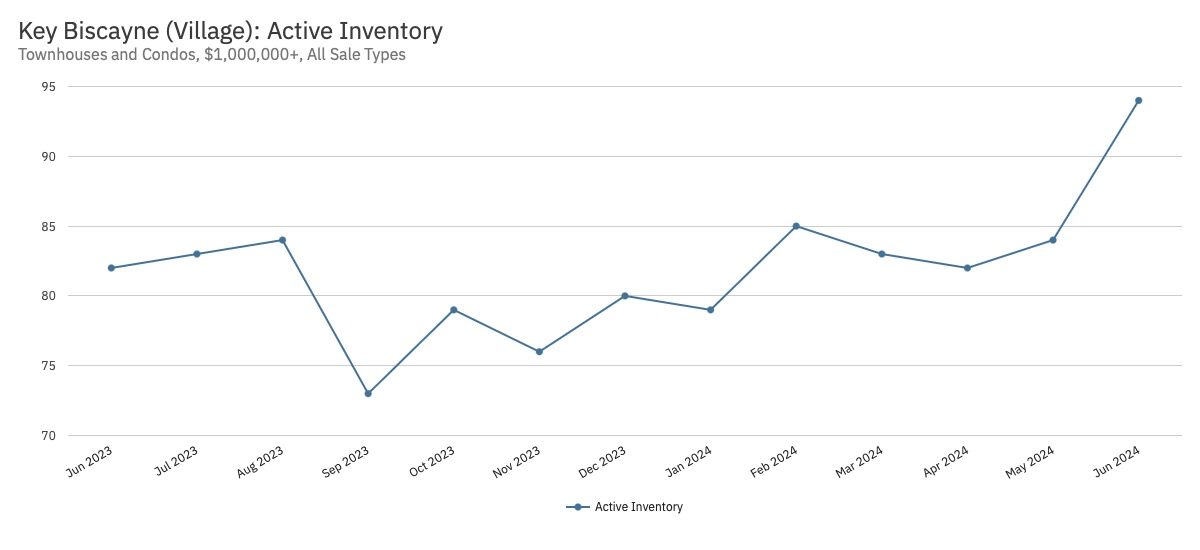
- Following national, regional, and local trends, active inventory is trending up this year, which is reflected in nominal listings. However, it is notable that 10 of the last 12 months have seen a drop in YoY available inventory. This helps explain the higher months of lower sales volume yet a relatively consistent pricing range.
New Listings

Observations:
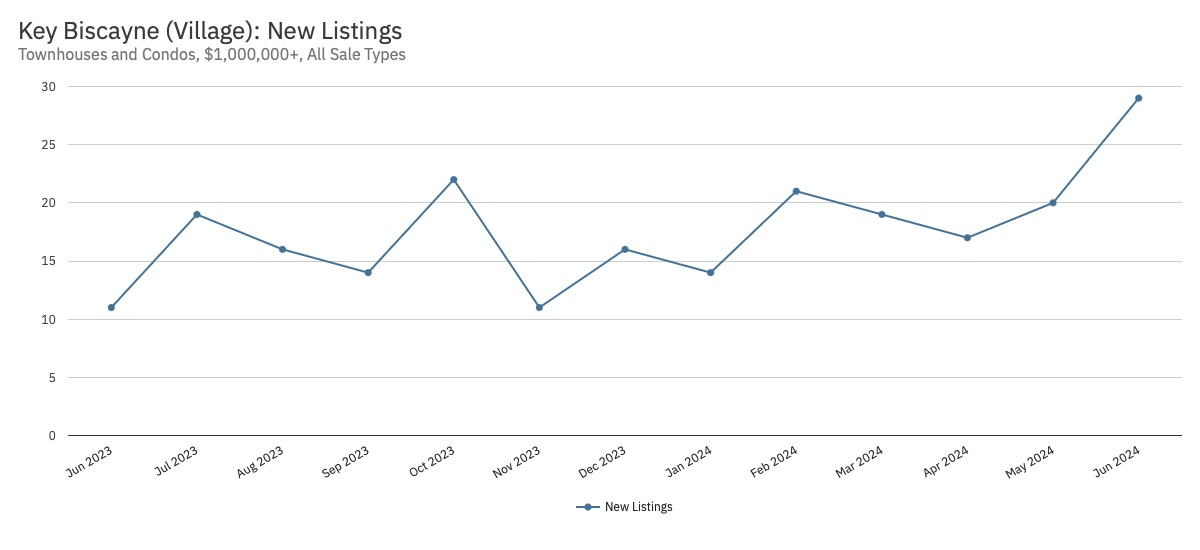
- Following national, regional, and local trends, new listing inventory is trending up this year (especially with a recent summer surge), which is reflected in nominal listings. However, like available actives, it is notable that 10 of the last 12 months have seen a drop in YoY new inventory. Along with an uptick in sales activity, the observation here supports the median sales pricing range we’re seeing.
Months of Supply


Observations:
- Months of Supply is another way of looking at the health of the market (buyers, sellers, or neutral). Following national, regional, and local trends, the supply of inventory is up considerably this year, with consistently added inventory each month. However, the YoY change is down for 7 out of the last 12 months. For luxury townhouses/condos in Key Biscayne, the data suggests it’s a buyers’ market, especially with the surge of recent inventory – however, units are selling, and pricing has been stable. I find it to be a healthy market for both buyers and sellers.
MIAMI BEACH
I. Single Family Homes (SFHs)
View Available ListingsSnapshot

Closed Sales


Observations:
- Closed sales of luxury Miami Beach SFHs are trending up for the year (with momentum gaining strength from spring into summer season). This sales activity is also up YoY, with 10 of the past 12 months higher or neutral compared to last year. Consistent with national, regional, and local news, demand for Miami Beach SFHs has been very strong. The greatest wealth migration in the history of South Florida is alive and well here.
Total Dollars Closed


Observations:
- Consistent with the metric above, total closed sales dollars of luxury SFHs in Miami Beach are strongly trending up for the year (with momentum also gaining strength from spring into summer season). This sales activity is also up YoY, with 10 of the past 12 months higher than last year (and 9 months over $100M closed!). Consistent with national, regional, and local news, demand for Miami Beach SFHs has been very strong as one of the most desirable places for a house in the country.
Median Sales Price


Observations:
- The median sales price has traded within a fairly consistent range over the last year, with a notably high outlier month pulled up by some big closings. While there have been 6 months of lower YoY change, the recent trend is certainly demonstrating a climb in median sales pricing over the last two quarters. Coupled with sales transactions and volume, this metric reinforces the story of the strong Miami Beach luxury SFH market.
Median Time to Closed Sale

Observations:
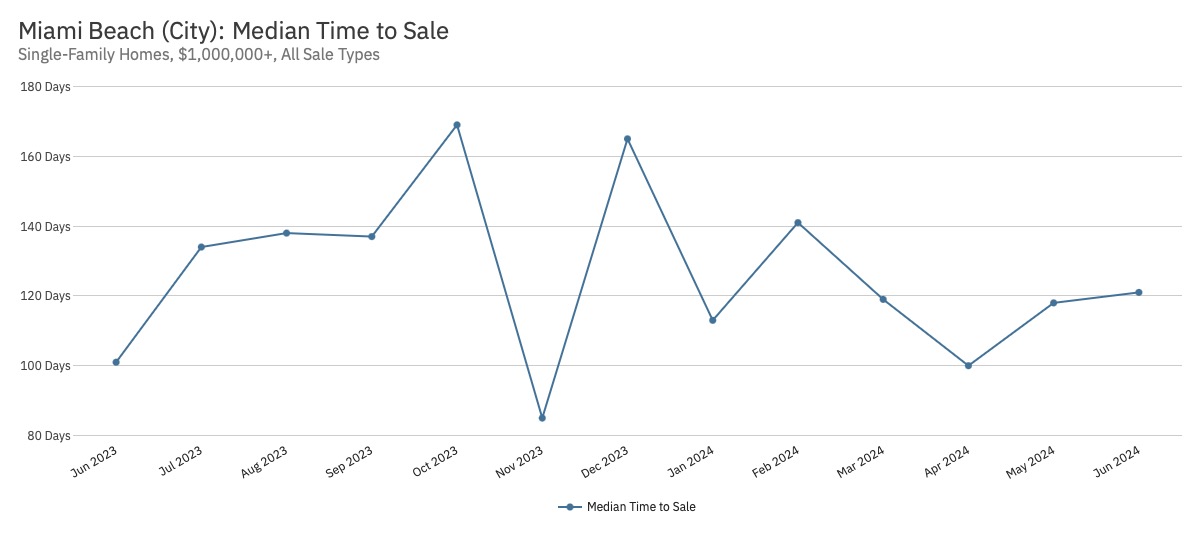
- The median time on market to a closed sale has been fairly steady over the last year, especially when considering three months that are outliers (both high and low). To me, this isn’t very surprising given the price tag of many Miami Beach luxury SFHs, where most sellers should generally consider 4–6 months as a healthy selling timeline.
Active Inventory

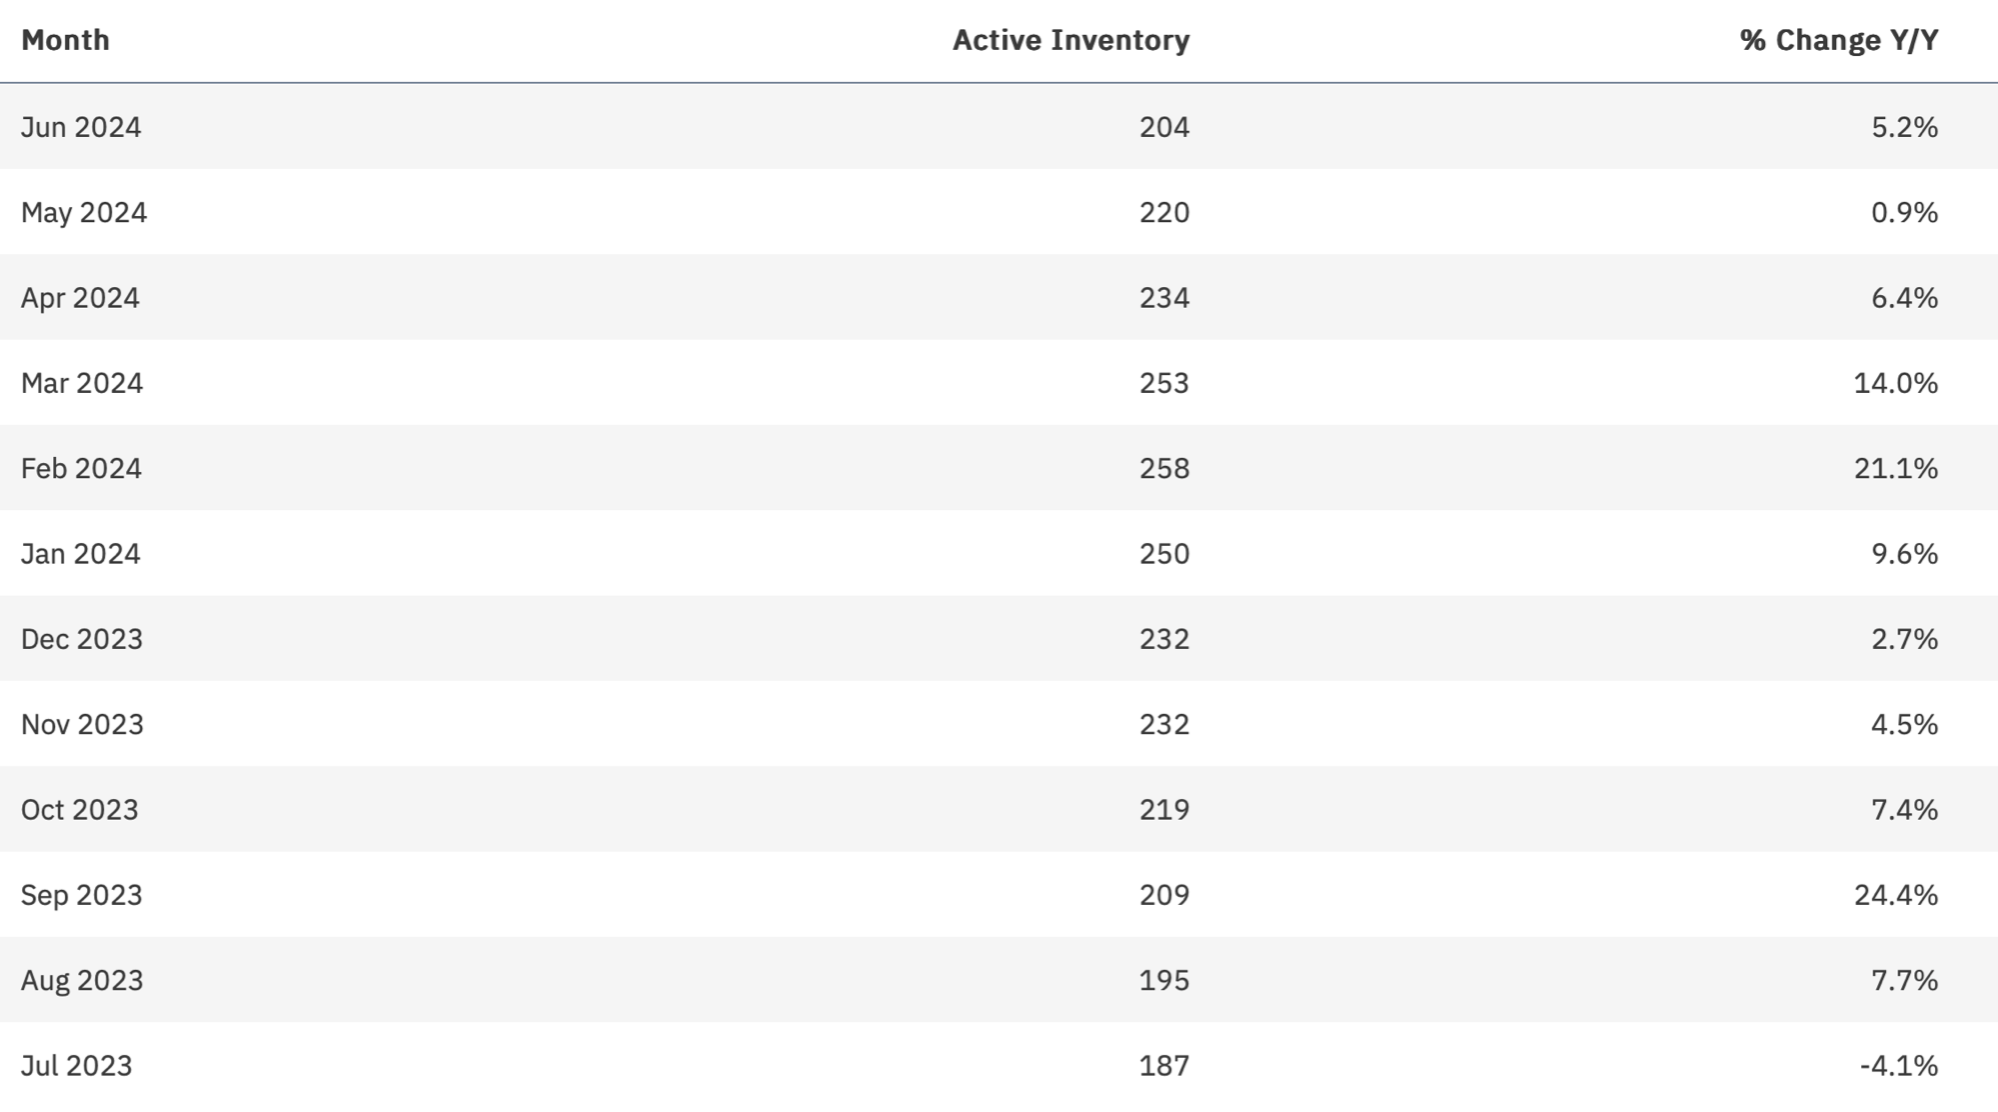
Observations:
- Following national, regional, and local trends, active inventory of luxury SFHs in Miami Beach was trending up last year and early this year, which is reflected in nominal listings (with relatively flat yet positive YoY change). However, inventory has notably dropped over the last quarter, coupled with strong sales activity.
New Listings

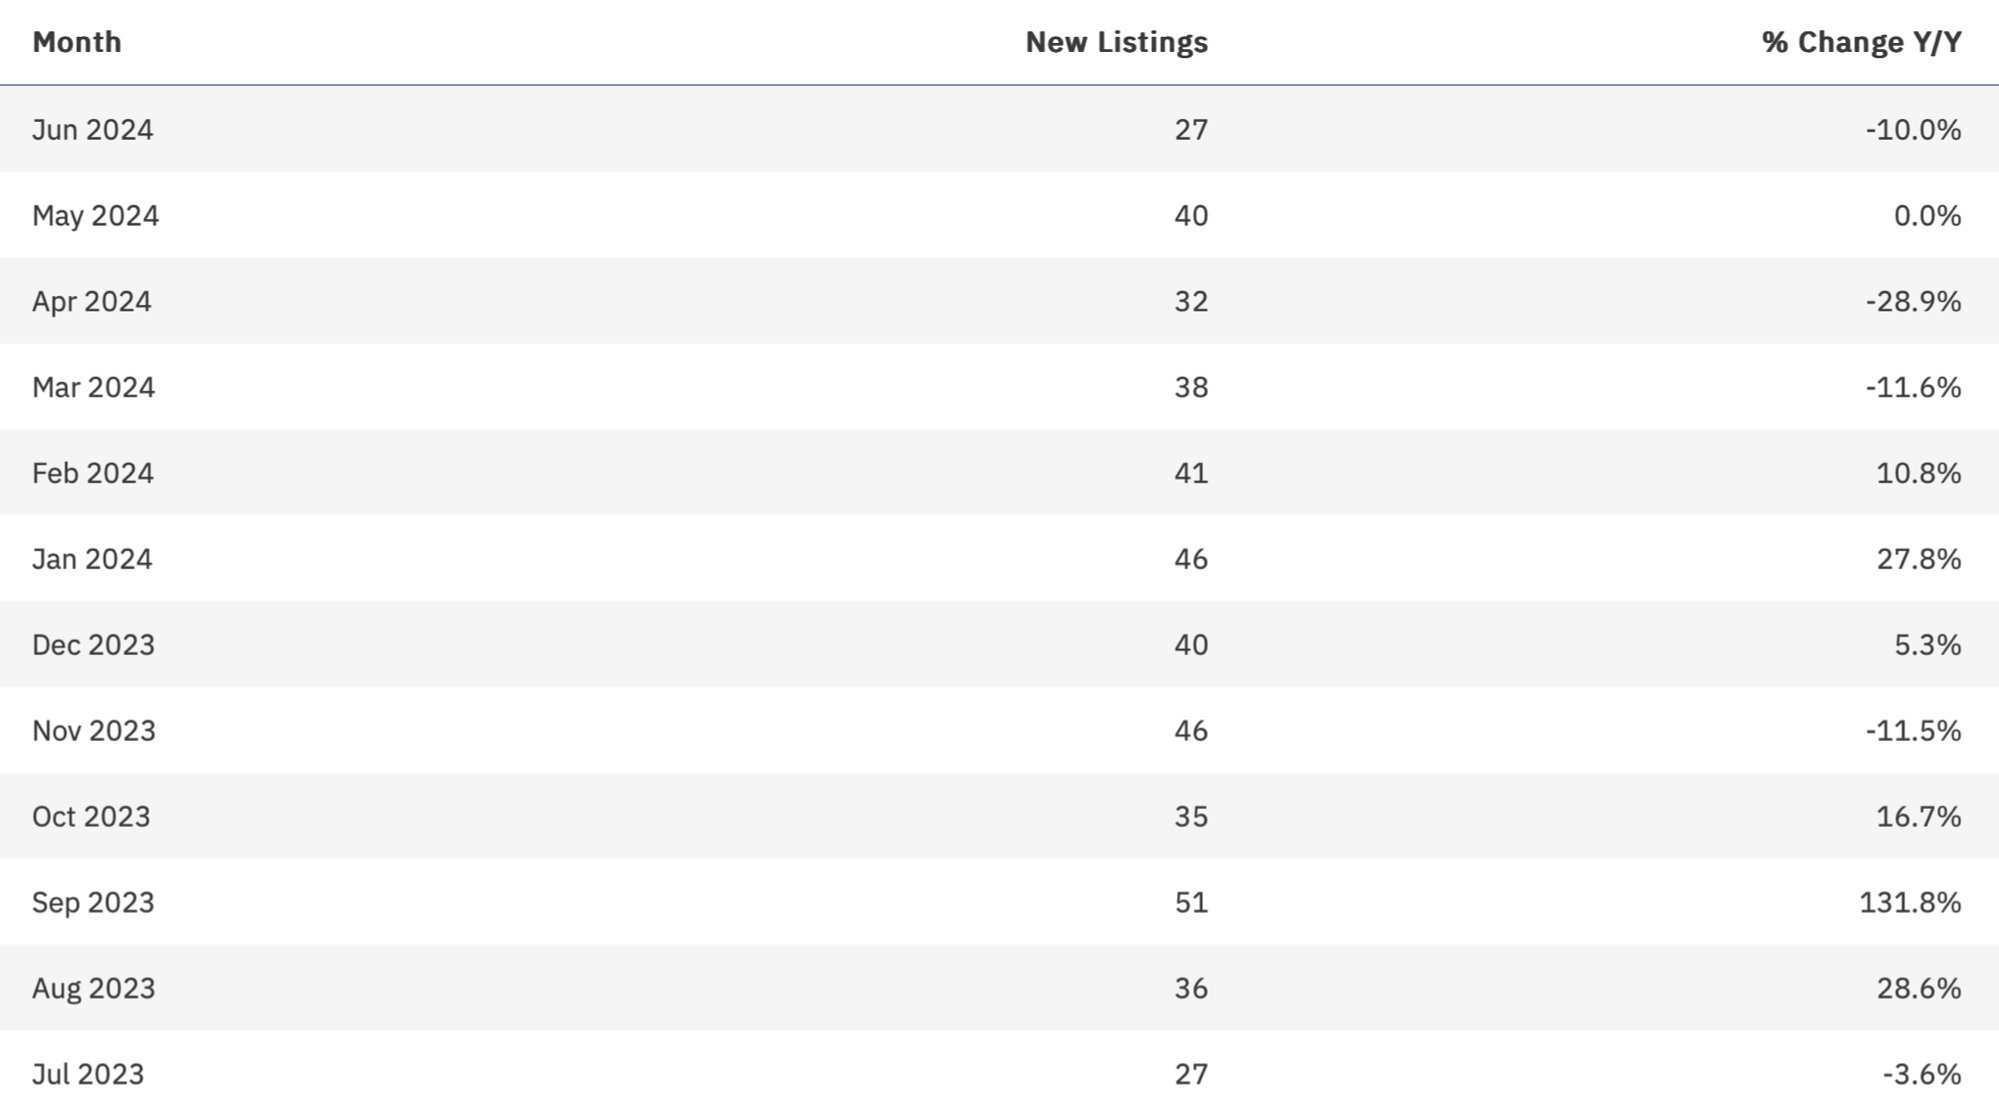
Observations:
- Following national, regional, and local trends, new listing inventory was trending up last year and into this year. However, new inventory and YoY change have been dropping over the last few months while sales transactions have been climbing. As no surprise, this has resulted in a median sales price trending higher within the corresponding period.
Months of Supply
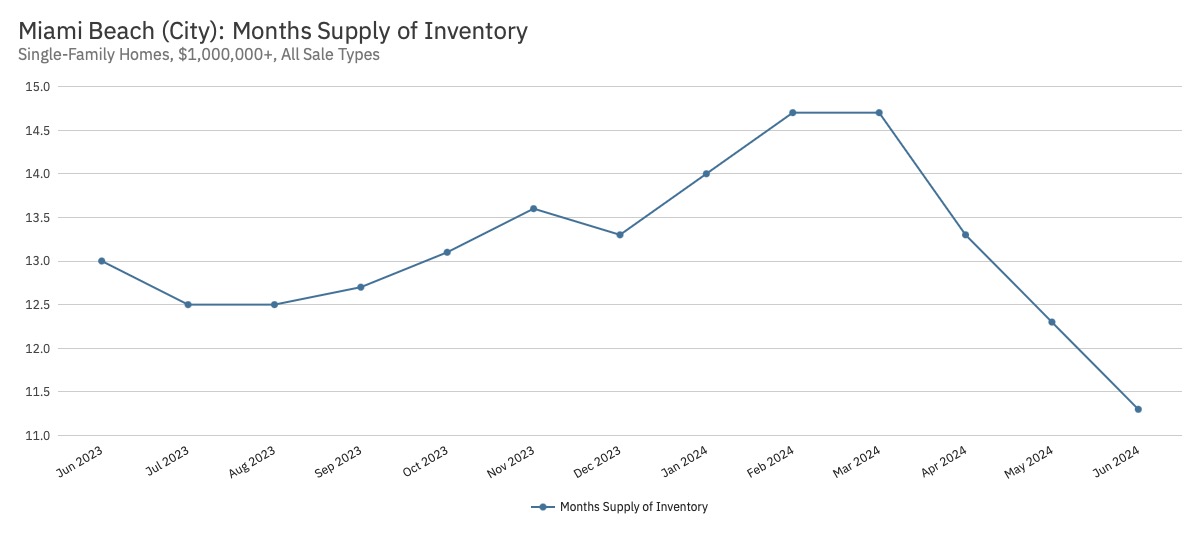

Observations:
- Months of Supply is another way of looking at the health of the market (buyers, sellers, or neutral). Bucking the national, regional, and local trends, the supply of luxury SFH inventory has been dropping over the last two quarters with strong absorption. For this property type, the data suggests it’s a buyers’ market (double digits), but Miami Beach isn’t your typical market – while deals are taking a little longer to close relative to other luxury SFH communities around South Florida, strong sales volume and pricing have followed. Overall, it’s been a great time to be transacting in Miami Beach.
II. Condos and Townhouses
View Available ListingsSnapshot

Closed Sales
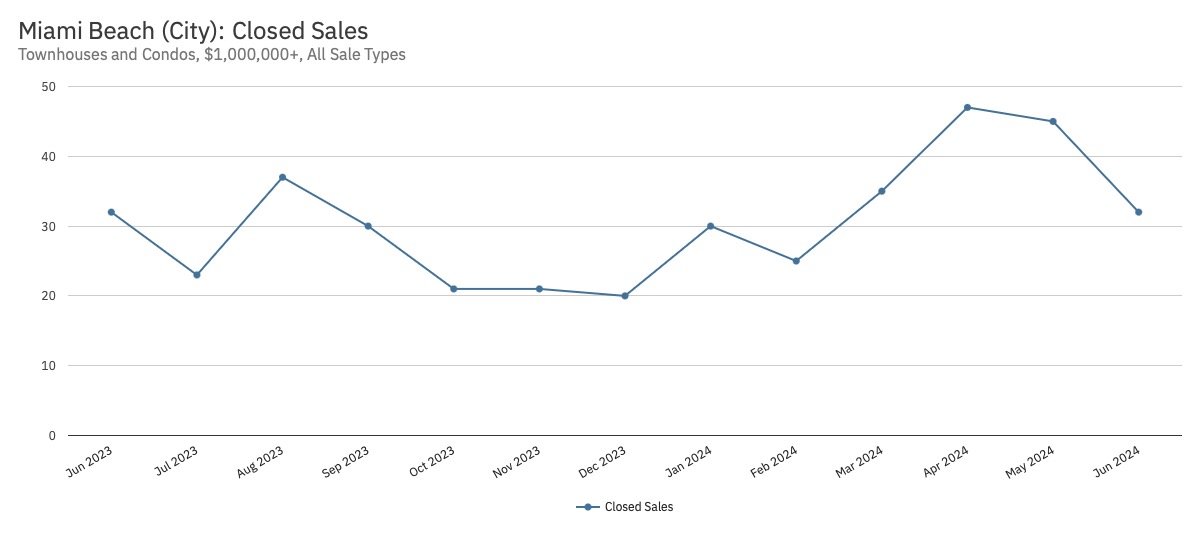
Observations:
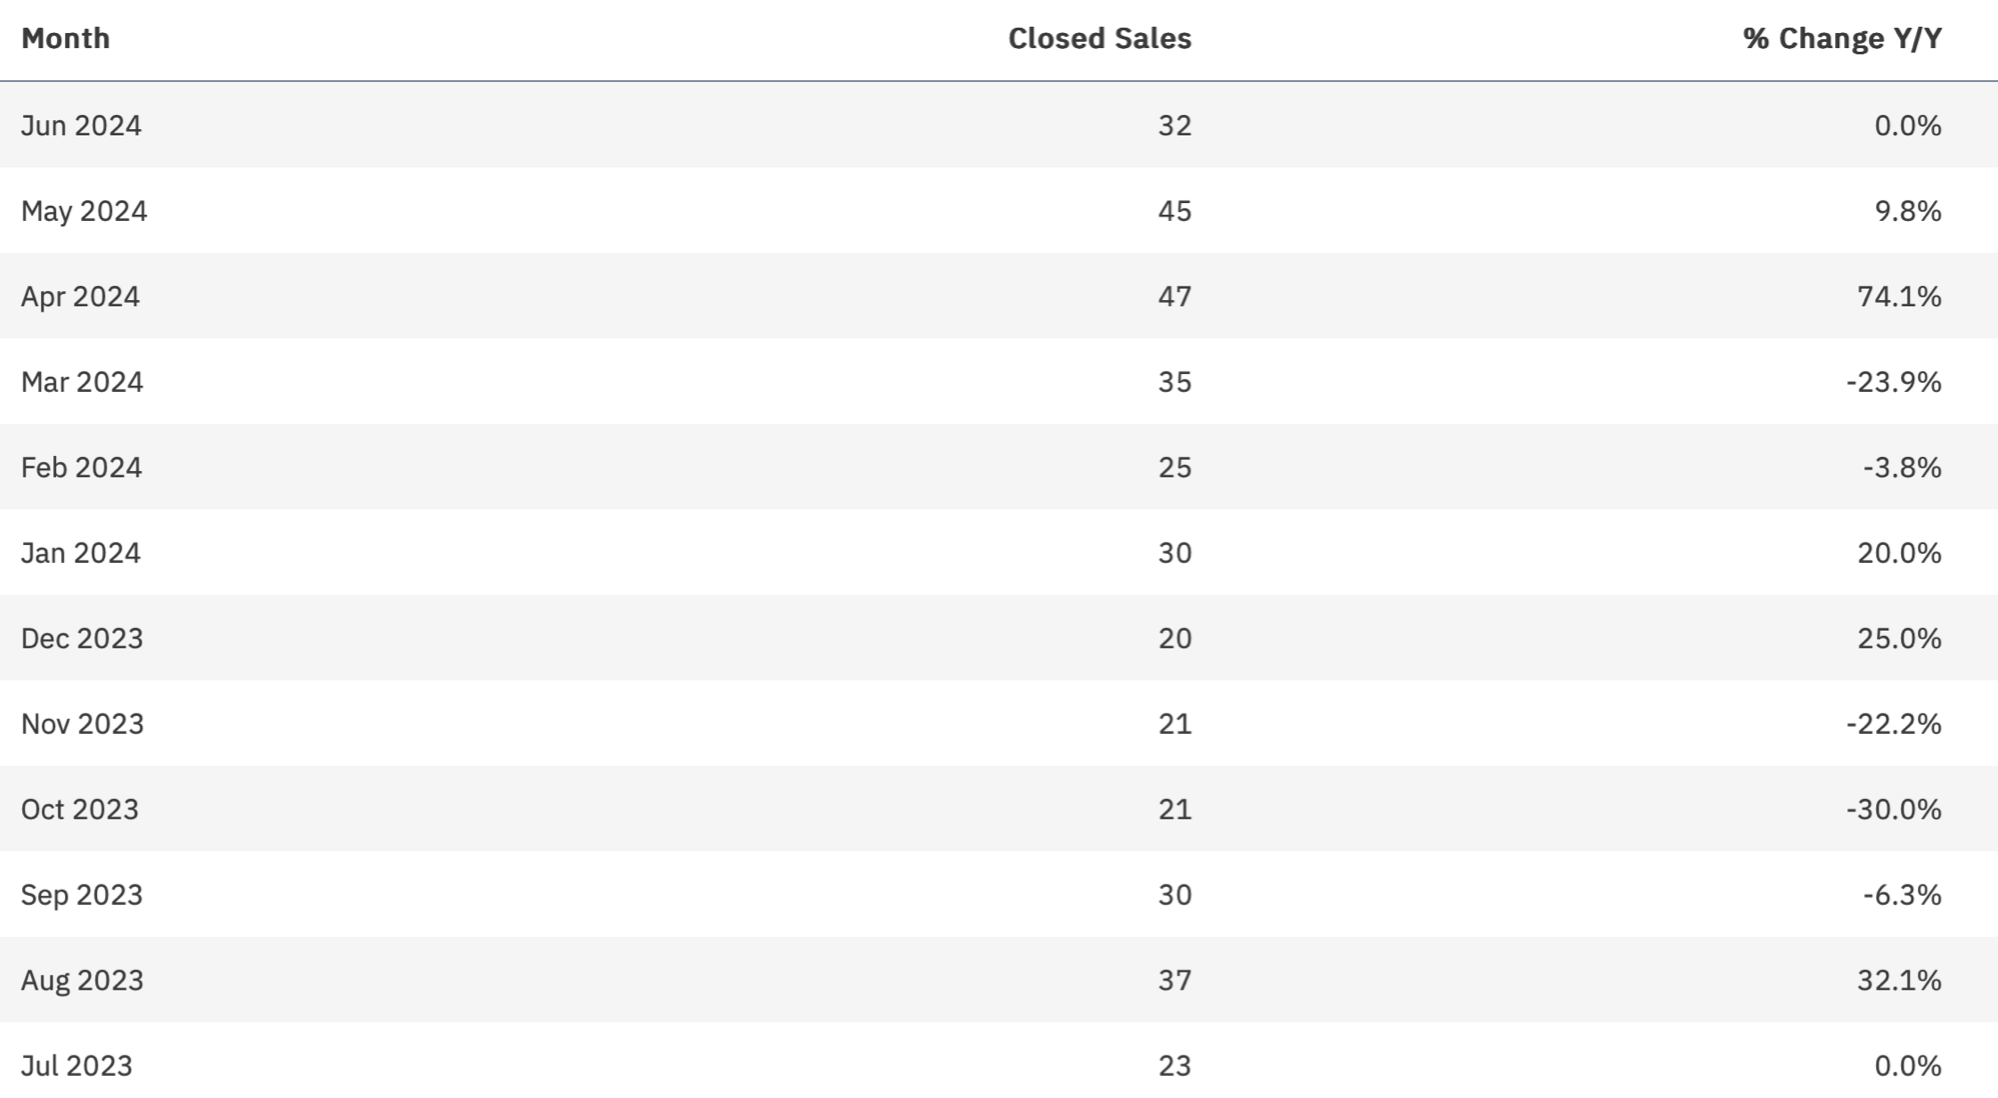
- Closed sales of luxury townhouses / condos in Miami Beach are trending up for the year, with a recent pullback (momentum has been gaining strength over the last two quarters). Seven of the last 12 months are higher or neutral YoY compared to sales last year. Consistent with national, regional, and local news, data shows that demand for Miami Beach luxury townhouses / condos has been very strong.
Total Closed Dollars
Observations:
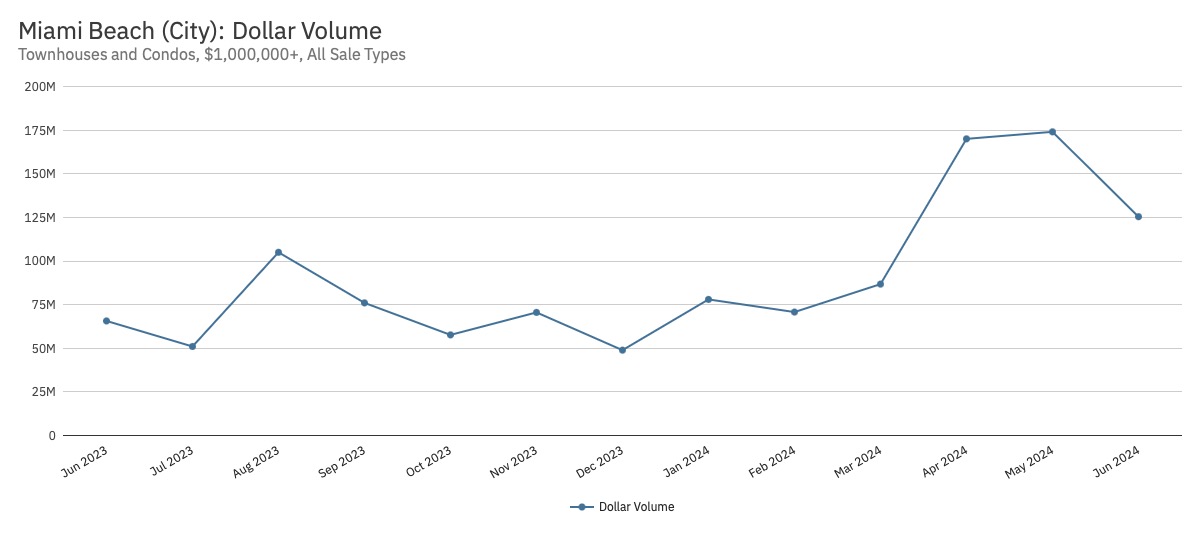
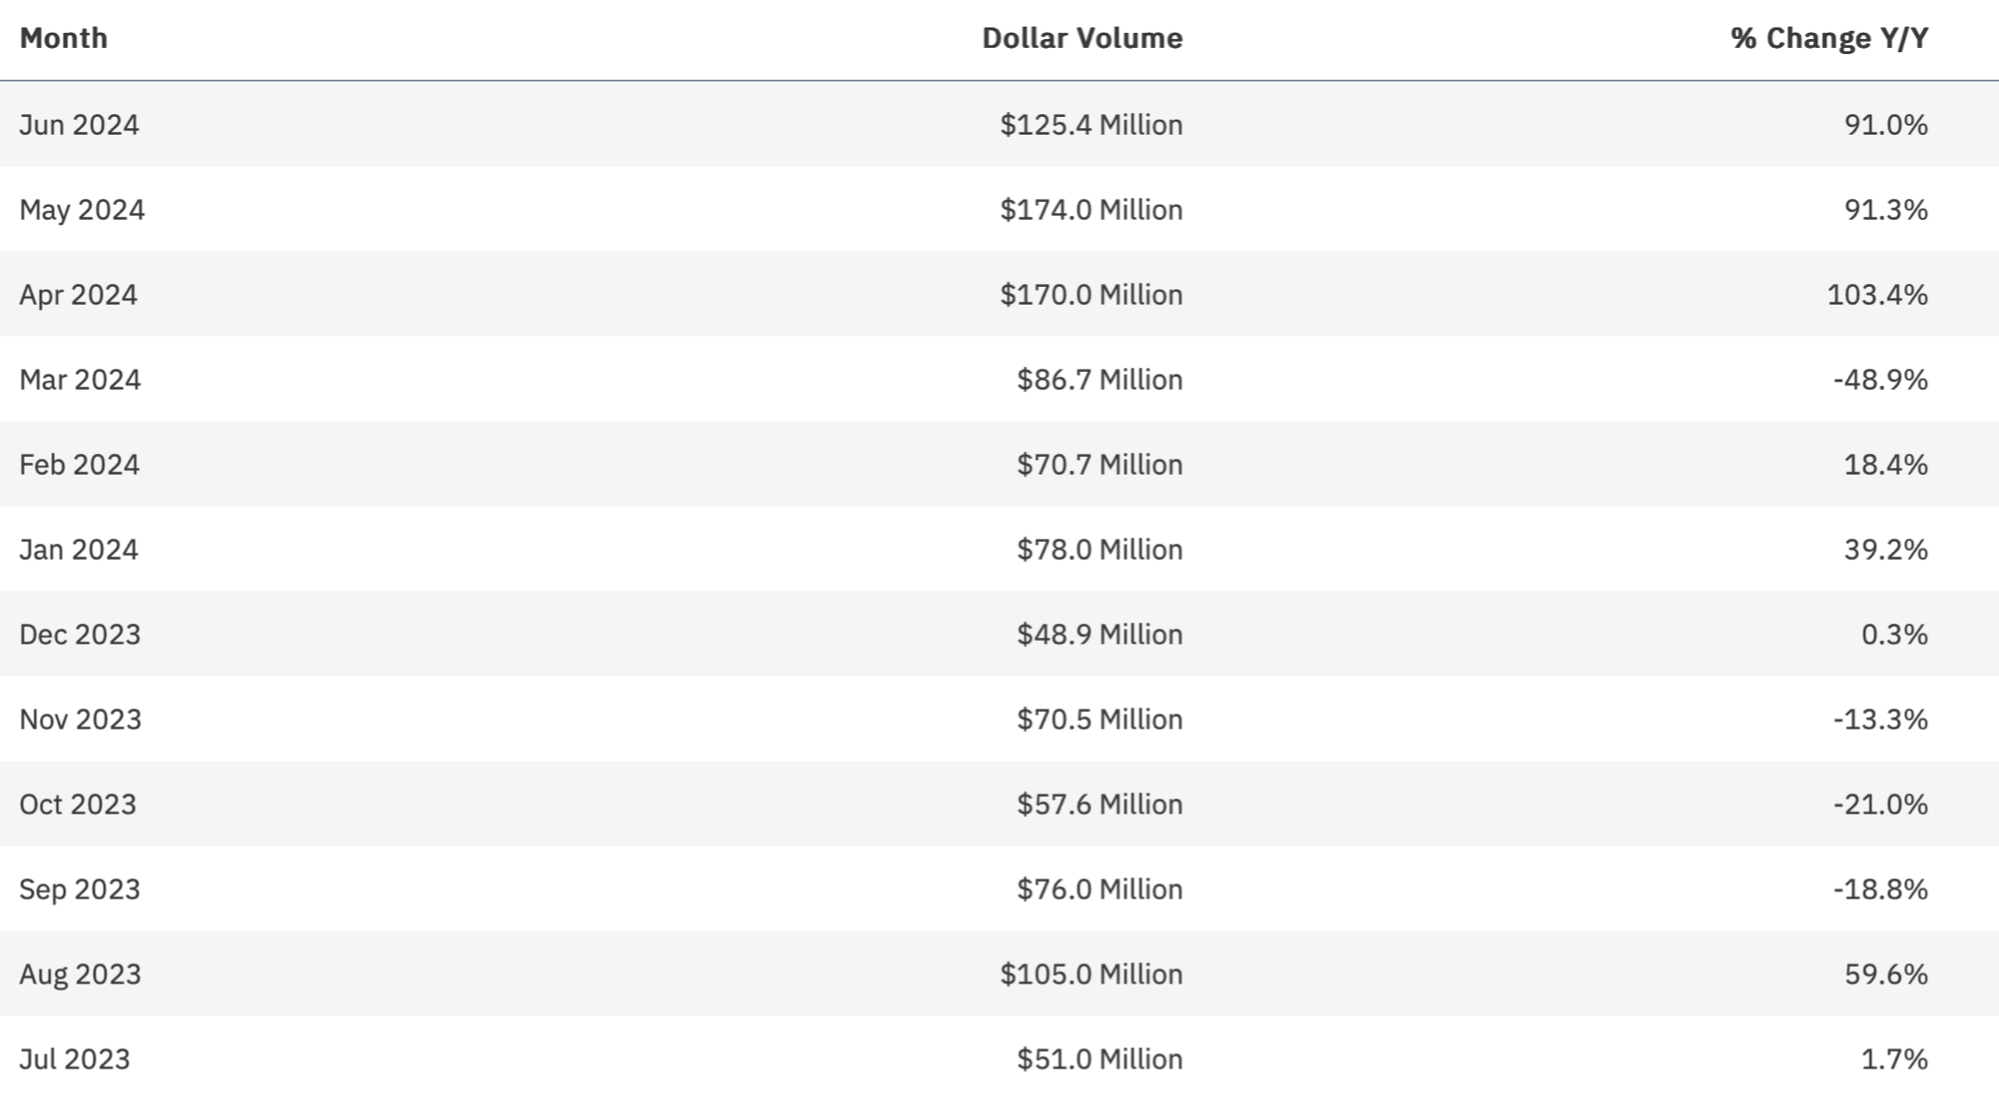
- Consistent with the metric above, total closed sales dollars of luxury Miami Beach townhouses/condos are also trending up for the year (with momentum gaining strength from spring into summer season with a recent pullback). This sales activity is also up YoY, with 8 of the past 12 months higher than last year (and 4 months over $100M closed!). Consistent with national, regional, and local news, data demonstrates that demand for this Miami Beach product type has been very strong.
Median Sales Price

Observations:
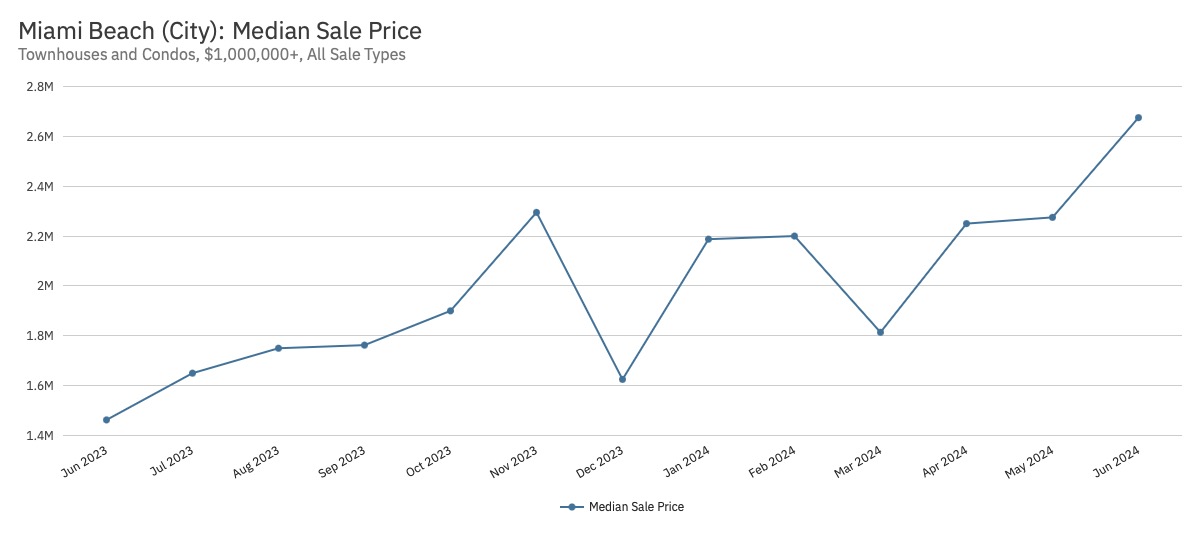
- The median sales price of luxury townhouses/condos in Miami Beach has grown notably higher over the last quarter, along with 9 positive months YoY. Coupled with the sales transactions and volume, this metric reinforces the story of the strong Miami Beach market. As I said before, the greatest wealth migration in the history of South Florida is alive and well here. Miami Beach represents one of the epicenters of this activity.
Median Time to Closed Sale


Observations:
- The median time on market to a closed sale for luxury townhouses/condos has been fairly steady in Miami Beach, especially when considering two months that are notorious for season transitions (June and October). This metric is very consistent with the timing and observations of SFHs in Miami Beach, and 4–6 months is a realistic timeline for this type of luxury product (and, candidly, there are a lot of units as you’ll see below).
Active Inventory


Observations:
- Welcome to the capital of luxury condos! Miami Beach is a very high-volume luxury market. Following national, regional, and local trends, active inventory was marching up last year and early this year, with every month also higher YoY. However, inventory has been dropping over the last quarter. Along with the increase in closed sales, this drop in supply supports the strong growth of the median sales price.
New Listings


Observations:
- Following national, regional, and local trends, new listing inventory of luxury townhouses/condos was trending up last year and early this year in Miami Beach. However, new inventory YoY has been dropping notably over the last few months while sales transactions have been climbing, resulting in both a drop in actives and a strong climb in median sales pricing.
Months of Supply

Observations:
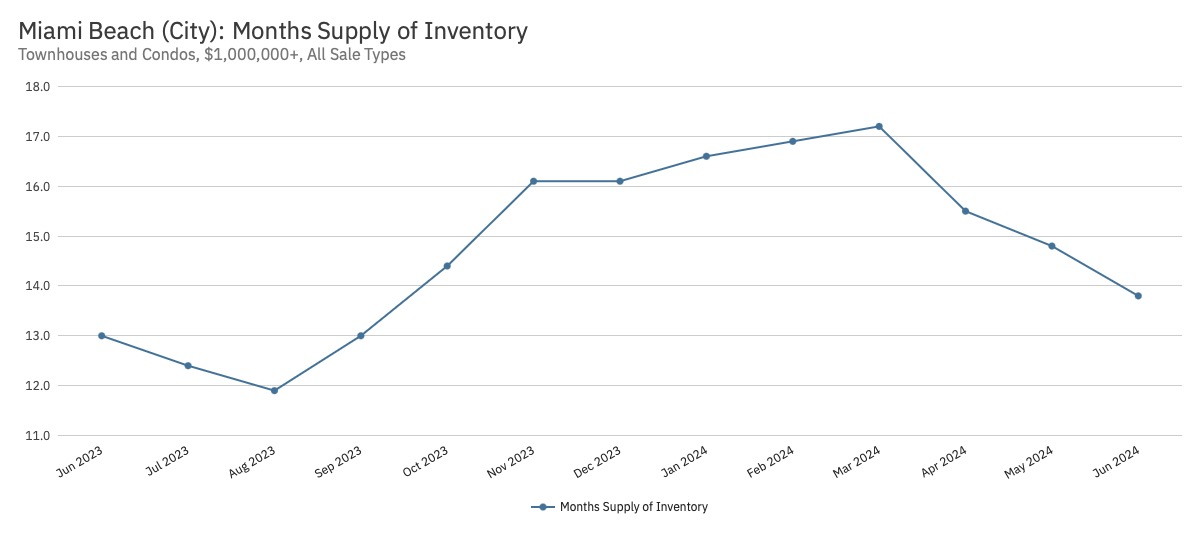
- Months of Supply is another way of looking at the health of the market (buyers, sellers, or neutral). Bucking the national, regional, and local trends, the supply of luxury townhouse/condo inventory has been dropping over the last two quarters in Miami Beach. For this property type, the data suggests it’s a buyers’ market (double digits), but Miami Beach isn’t your typical market – while deals are taking a little longer to close than in other luxury townhouse/condo communities around South Florida, strong sales volume and pricing have followed. Given the lack of new inventory hitting the market, expect this trend to continue.
All MIAMI-DADE
I. Single Family Homes (SFHs)
View Available ListingsSnapshot

Closed Sales


Observations:
- Miami-Dade is having a strong luxury SFH market in 2024 thus far. Closed sales of luxury SFHs are trending up for the year (with momentum gaining strength from spring into summer relocation season). This sales activity is also up YoY, with 11 of the past 12 months higher compared to last year. Consistent with national, regional, and local news, data demonstrates demand for Miami luxury SFHs has been very strong. As a recurring theme – the greatest wealth migration in the history of South Florida is alive and well in the county.
Total Dollars Closed


Observations:
- Consistent with the metric above, total closed sales dollars of luxury SFHs in Miami-Dade are also trending up for the year (with momentum also gaining strength from spring into summer season). This sales activity is also up YoY,with 11 of the past 12 months higher than last year (with two of the last months close to $800M in sales).Consistent with national, regional, and local news, data demonstrates demand for this product type in the county has been very strong.
Median Sales Price

Observations:
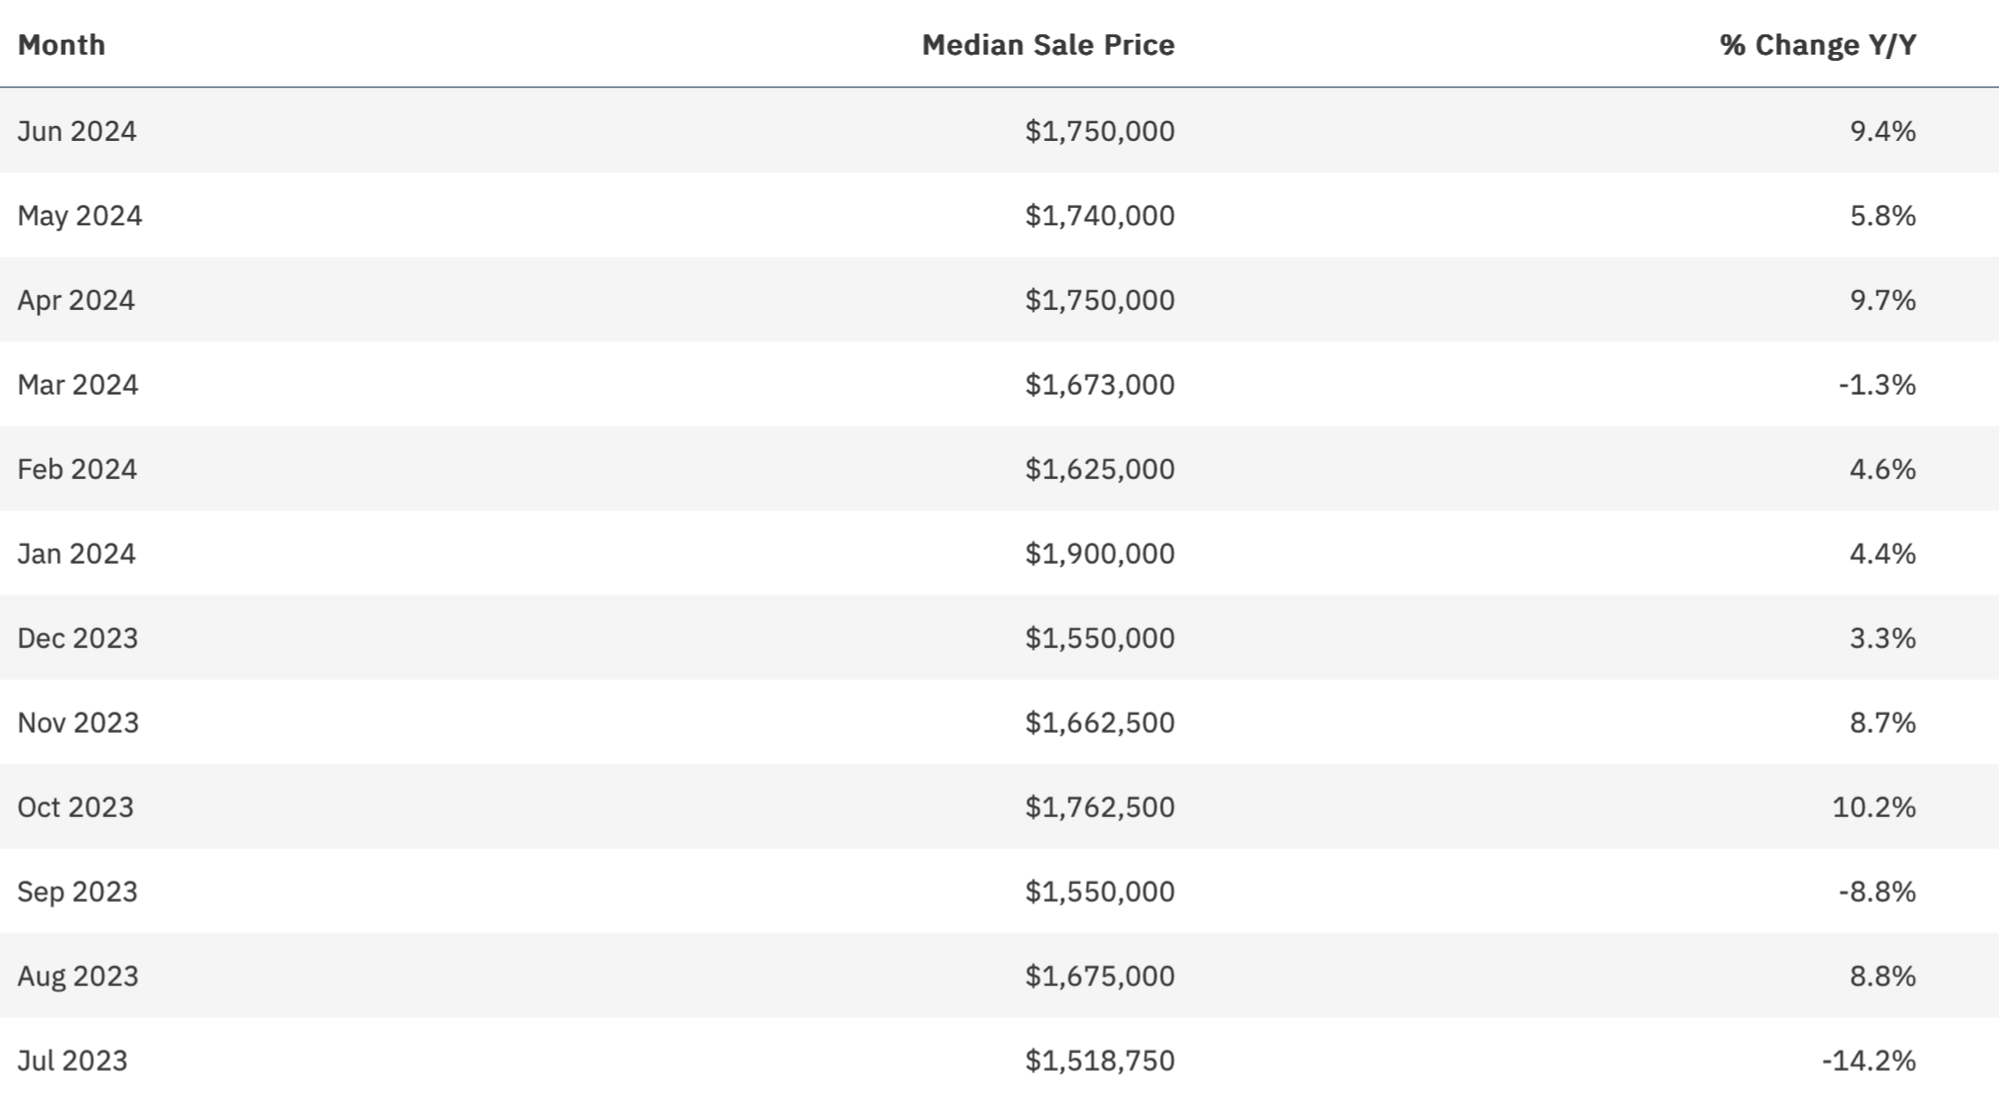
- The median sales price in Miami-Dade has steadily climbed over the last year (including a turn-of-the-year surge), along with 9 positive months of price growth YoY. Coupled with the sales transactions and volume, this metric reinforces the story of a robust Miami-Dade luxury SFH market.
Median Time to Closed Sale


Observations:
- The median time on market to a closed sale in Miami-Dade has been fairly steady and relatively quick for luxury SFH products (compared to other counties and cities). Eight out of the last 12 months have seen timelines to the closing table drop YoY, with that trend accelerating since February.
Active Inventory


Observations:
- Following national, regional, and local trends, active inventory of luxury SFHs has been steadily increasing over the last year in Miami-Dade. This is reflected in terms of both nominal actives and YoY growth (which has been accelerating recently). You can definitely feel more SFHs on the market when driving around luxury communities and see the inventory growing on the MLS. I consider this pent-up demand from sellers who want to sell but didn’t due to various macro and local economic factors over the last two years (such as being locked into good mortgages and concerns over the price of what to buy next).
New Listings


Observations:
- Following national, regional, and local trends, new listing inventory of luxury SFHs in Miami-Dade was trending up last year and early this year. However, new inventory recently pulled back, and YoY change dropped notably over the last month, but is still up from 2023. In fact, 11 of the last 12 months have seen YoY gains in new listings.
Months of Supply


Observations:
- Months of Supply is another way of looking at the health of the market (buyers, sellers, or neutral). Bucking the national, regional, and local trends, the supply of inventory in Miami-Dade for luxury SFHs has been slightly dropping over the last two quarters. For this property type, the data suggests it’s a buyers’ market. Countywide, this makes sense, but keep in mind various luxury neighborhoods are seeing higher or lower months of supply depending on their localized demand.
II. Condos and Townhouses
View Available ListingsSnapshot

Closed Sales


Observations:
- Miami-Dade luxury townhouse/condo sales as a whole enjoyed a strong Q1 before seeing a decline in sales entering the summer, with a noticeable drop in transactions and YoY change.
Total Dollars Closed

Observations:
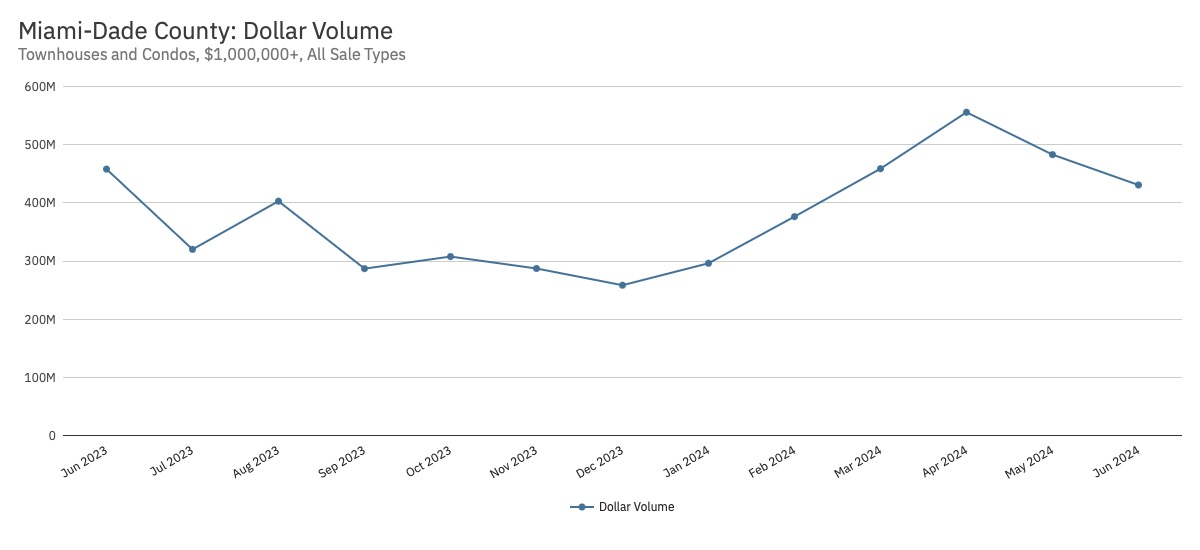
- Consistent with the metric above, total closed sales dollars of luxury townhouses/condos in Miami-Dade enjoyed a strong period to start the year before cooling heading into the summer. Regardless, sales volume is considerably higher during the first six months of 2024 compared to the last six months of 2023.
Median Sales Price


Observations:
- The median sales price of Miami-Dade luxury townhouses/condos saw a peak in January 2024 and has been on a steady decline through the first half of this year. YoY change is recently relatively flat and up from a low point in May that appears to be a floor over the last year.
Median Time to Closed Sale


Observations:
- The median time on market to a closed sale of luxury townhouses/condos in Miami-Dade has fluctuated within a pretty established range. This time to the closing table is slower than that of luxury SFHs but faster compared to other South Florida counties. Once again, 4–6 months is a healthy expectation for luxury sellers priced to sell.
Active Inventory

Observations:
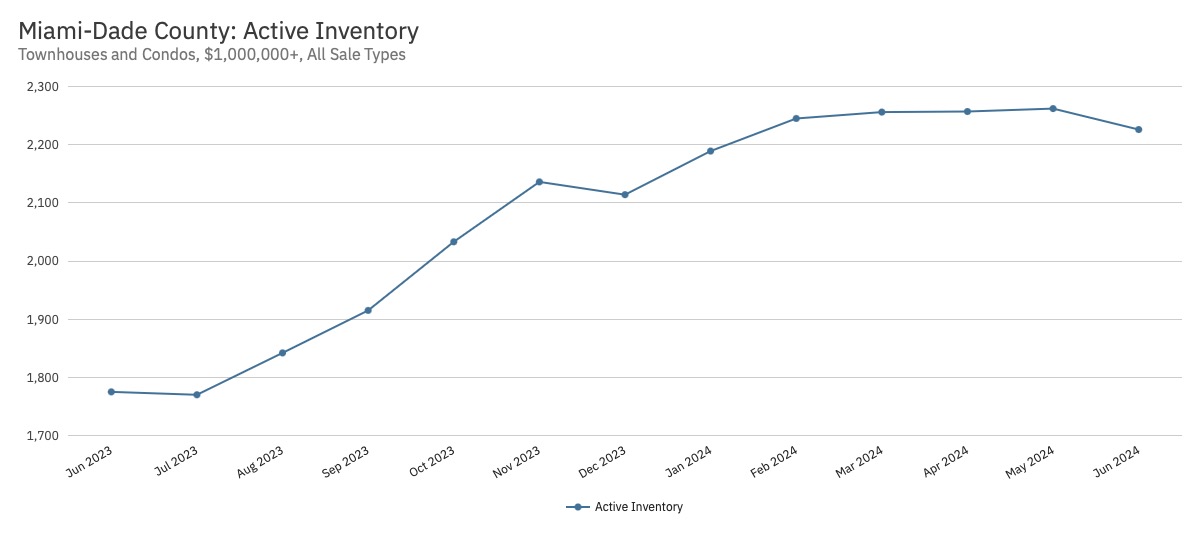
- Following national, regional, and local trends, active inventory of luxury townhouses/condos is on the march up over the last year in Miami-Dade. This is reflected in terms of both nominal actives and YoY growth (which has been accelerating recently, with 11 of the last 12 months up compared to the prior year). You can definitely feel more luxury townhouses/condos on the market and see the inventory growing on the MLS. I primarily attribute this to: i) delivery of new luxury condo units; and ii) pent-up demand from sellers who want to sell but didn’t due to various macro and local economic factors over the last two years.
New Listings

Observations:
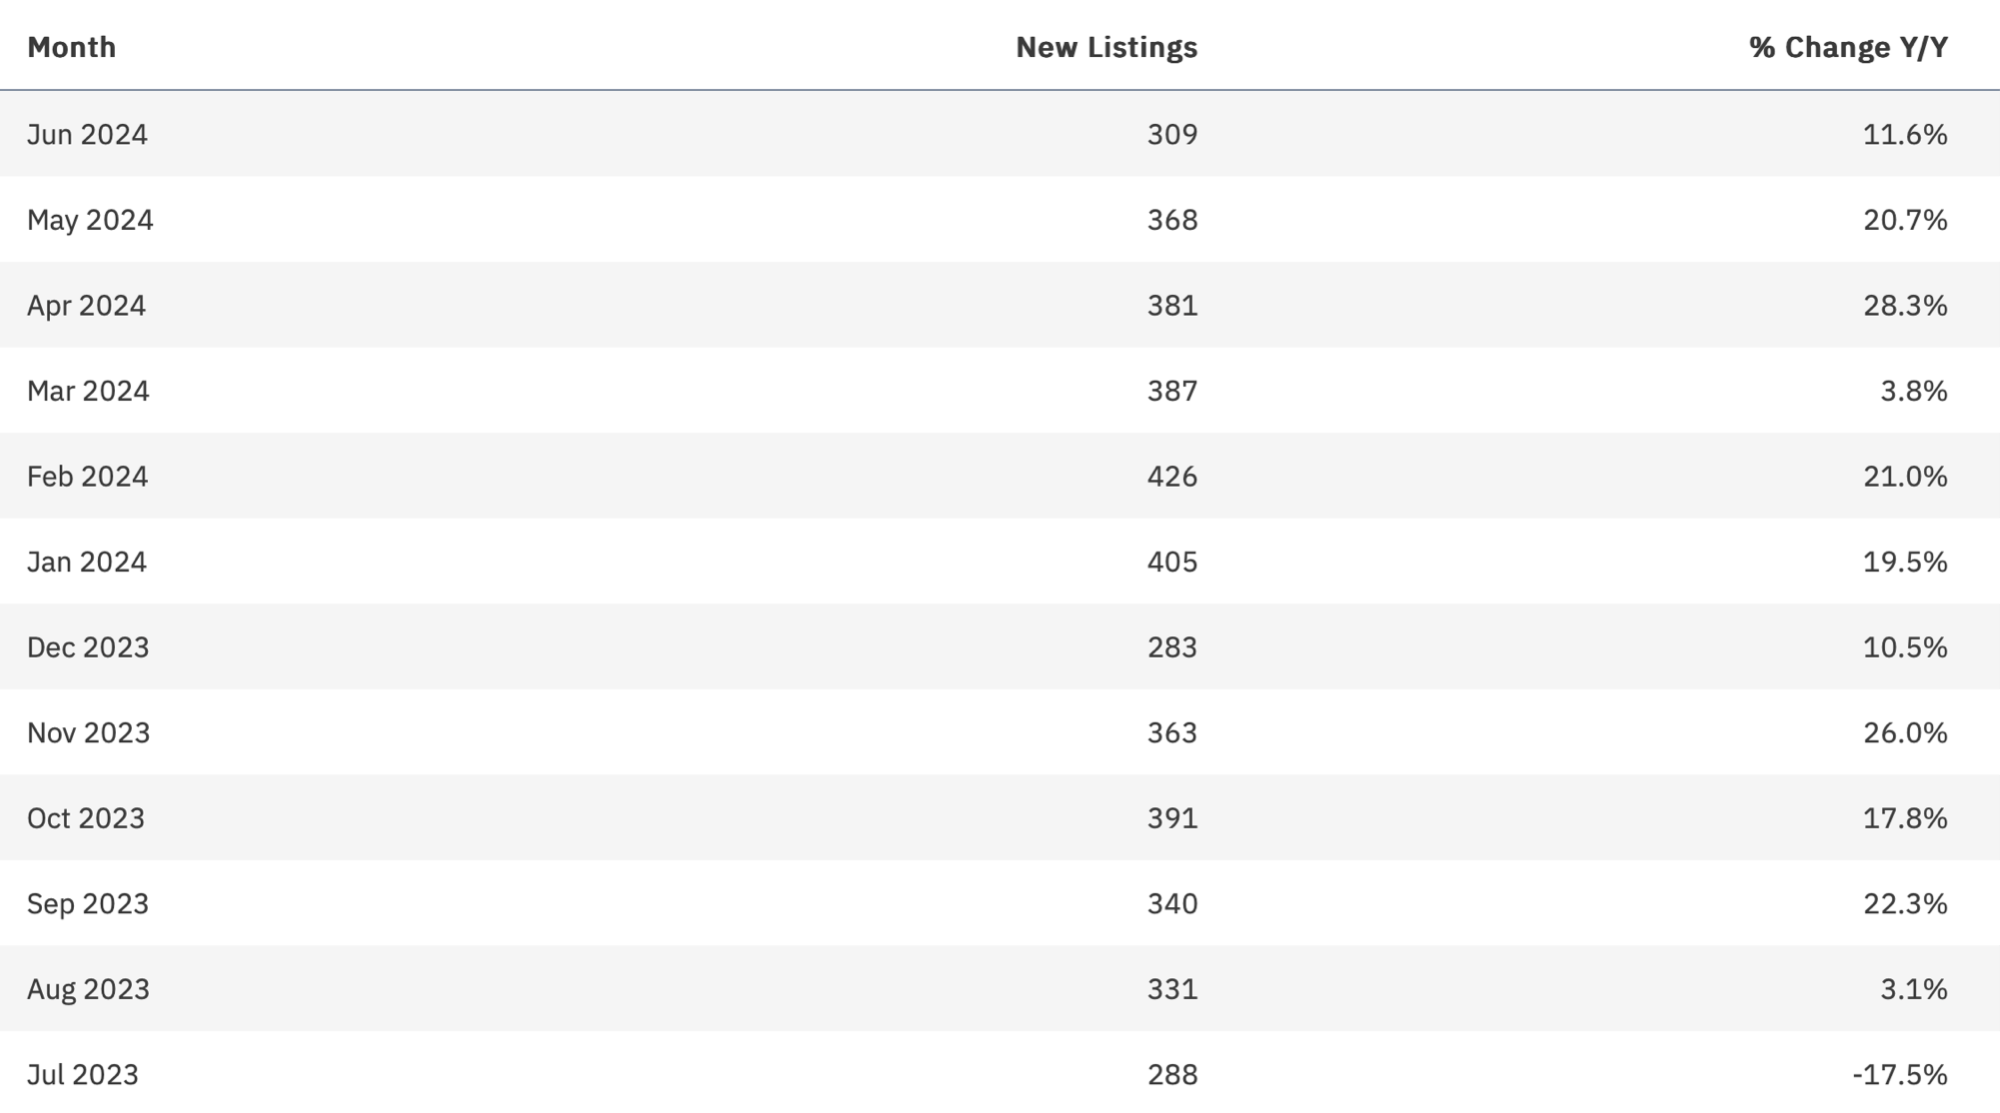
- Following national, regional, and local trends, new listings of luxury townhouses/condos were trending up for much of the last year and early 2024 in Miami-Dade. However, since February, there has been a notable decline per month in new listings, but activity is still up YoY. This is reflected in terms of both nominal new listings and YoYgrowth (which has been higher in 11 of the last 12 months compared to the prior year).
Months of Supply

Observations:
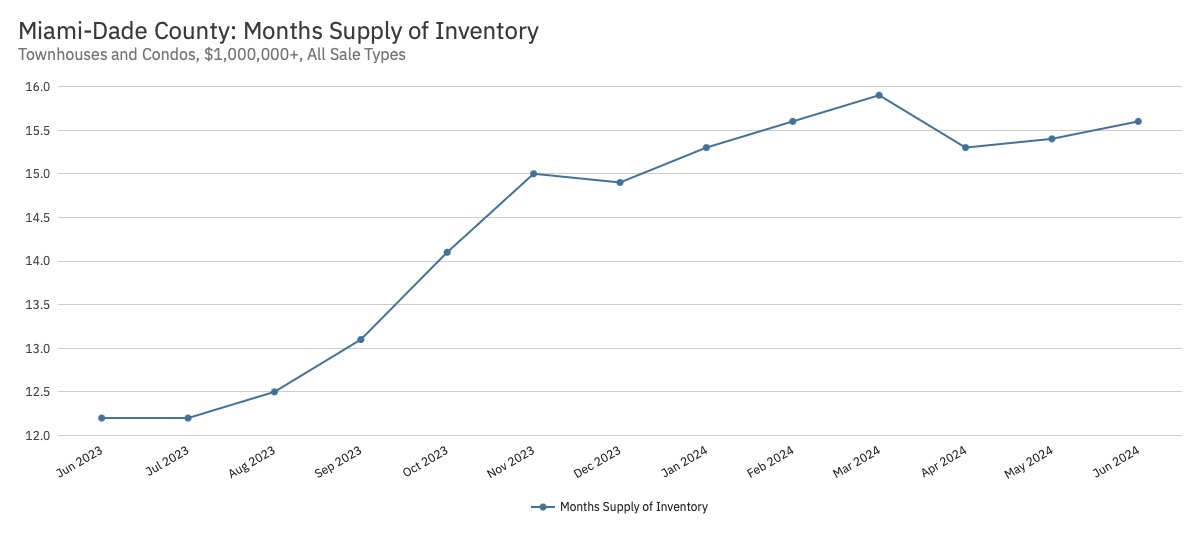
- Months of Supply is another way of looking at the health of the market (buyers, sellers, or neutral). Following national, regional, and local trends, the supply of luxury townhouse/condo inventory has been growing consistently over the last year in Miami-Dade. Every month over the last year has seen supply up YoY. For this property type, the data indicates it’s a strong buyers’ market, and that’s consistent with the feel on the ground, especially for the luxury condo market as a whole (with some notable exceptions based on the building). This growing level of supply is a major reason why you see a countywide cooling in median sales pricing.
DISCLAIMERS AND NOTICES
- Data relied on within this blog and market report are from i) BeachesMLS and ii) MIAMI Association of REALTORS as of the date of this blog. This data is not verified for authenticity or accuracy and may not reflect all real estate activity in the market. Based on information © 2024 BeachesMLS, Inc.
- This blog and market report are not to be considered investment advice nor a solicitation for investment.
- Purchasing or selling real estate is an important financial decision. Make your own buying, selling, or investment decision based on your own analysis and due diligence, along with the consultation of your own professional advisors.
- The content of this blog and market report is for information and educational purposes only. Any commentary is solely the professional opinion of Jennie Frank Kapoor and/or Tropical Phoenix Homes and does not reflect the opinion of Engel & Völkers, any MLS, Florida Realtors, nor any other group. Errors and typos are possible, and you should verify all information before taking any actions.
- Copyright © 2024 of all original photos and content within this blog and market report, which are the property of Engel & Völkers, Jennie Frank Kapoor, Florida Realtors, and/or Tropical Phoenix Homes (“IP Holders”). No photos or content may be utilized or reproduced without the prior written consent of the IP Holders.
Categories
- All Blogs (44)
- Bahamas (3)
- Boca Raton (1)
- Brand Partners (1)
- Broward County (10)
- Coconut Grove (1)
- Coral Gables (7)
- Delray Beach (1)
- E&V Global (3)
- Events (1)
- Fort Lauderdale (13)
- Key Biscayne (1)
- Lauderdale-by-the-Sea (4)
- Market Report (16)
- Miami Beach (1)
- Miami-Dade County (3)
- New Construction (1)
- News and Updates (11)
- Open Houses (1)
- Opportunities (4)
- Palm Beach (Town) (1)
- Palm Beach County (1)
- Podcasts and Videos (13)
- Pompano Beach (2)
- Sea Ranch Lakes (8)
- South Florida (7)
- Thicken the Plot Series (7)
- Values Series (10)
- West Palm Beach (1)
Recent Posts
